October boost for accommodation – Stats NZ Media and Information Release: Accommodation survey: October 2018

October boost for accommodation 17 December 2018

Guests spent more nights in hotels, motels, and holiday parks in October, Stats NZ said today.

Overall guest nights rose 3.9 percent in October 2018 compared with October 2017, helped by more nights spent in hotels, motels, and holiday parks. However, fewer nights were spent in backpackers than last October, down 2.1 percent.


Annual backpacker guest nights have been tapering off since a peak in the year ended December 2017. Nights spent in backpackers fell 1.7 percent in the year ended October 2018 from the previous October year.

“Since the annual high for backpacker nights in 2017, nights have dropped off the most in the West Coast and Nelson/Marlborough/Tasman regions, while nights in Canterbury and Waikato have risen,” acting accommodation and constructions statistics manager Dave Adair said.

Falling guest nights can be influenced by a variety of factors, typically by guests spending fewer nights in accommodation, but also by businesses shutting down or changing the type of accommodation they offer. Accommodation type changes can include a backpacker becoming a hotel or motel, or by converting to long-term accommodation, which is excluded from the survey.

Total guest nights continued to reach record levels at 40.2 million in the year ended October 2018, up 2.6 percent from the October 2017 year. Hotels, motels, and holiday parks recorded increases, up 3.9 percent, 0.8 percent, and 5.8 percent respectively.

The Accommodation Survey collects data for guests staying in short-term commercial accommodation such as hotels, motels, backpackers, and holiday parks. Hosted and private accommodation, such as bed and breakfasts and holiday homes, are excluded.

For more information about these statistics:

Auckland home consents hit 13,000 – Stats NZ Information Release: Building consents issued: October 2018

Auckland home consents hit 13,000 – 30 November 2018

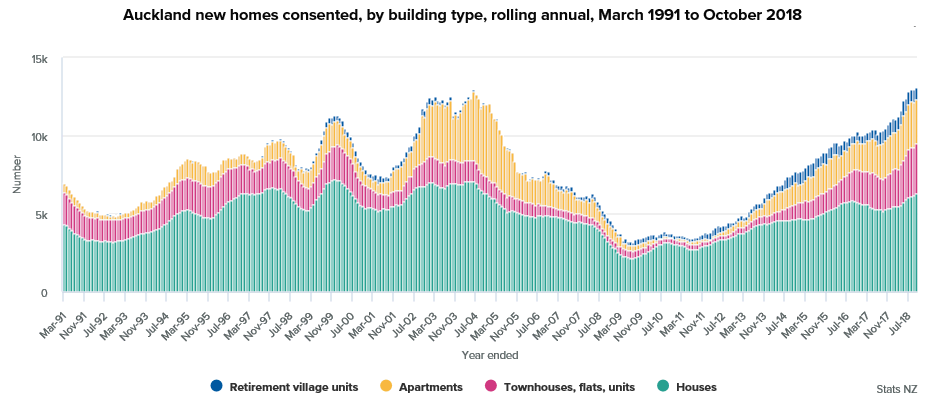
More than 13,000 new homes were consented in Auckland in a year for the first time since the 1970s, Stats NZ said today.

A total of 13,078 new homes were consented in the region in the year ended October 2018 – up 25 percent from the year before, and four times as many as the low point in the August 2009 year.

“Home permits in Auckland briefly reached a similar high level in the early 1970s, when Auckland’s population was less than half what it is now,” acting construction statistics manager Dave Adair said.

“The number of new homes consented also came close to 13,000 in the June 2004 year.”

Over the past year, only 48 percent of consented new homes in Auckland were stand-alone houses (74 percent across the rest of New Zealand). The remaining 52 percent were apartments, townhouses, retirement village units, and flats.

In the year ended October 2018, a total of 32,925 new homes were consented in New Zealand – up 6.7 percent from the October 2017 year. Auckland was the main driver of this increase, followed by Wellington. The picture was mixed for other parts of the country, with the largest annual declines being in Canterbury and Bay of Plenty.

Home consents up in October month

Nationally, the number of new homes consented rose 1.5 percent (seasonally adjusted) in October 2018, reversing a 1.3 percent fall in September.

For more information about these statistics:

Stats NZ Report: International Visitor Arrivals to New Zealand: October 2018

International Visitor Arrivals to New Zealand – 26 November 2018

The latest edition of International Visitor Arrivals to New Zealand: October (IVA) is now available on the Stats NZ website.

IVA is a monthly report produced by Stats NZ and sponsored by Tourism New Zealand. It contains detailed tables and graphs of monthly and annual data, showing the number and characteristics of visitor arrivals. IVA provides information in addition to the visitor arrivals information released two working days earlier in the International Travel and Migration: October 2018 release. In particular, airport information released in the IVA is not included in the international travel and migration statistics.

Record annual guest nights surpass 40 million – Stats NZ Media and Information Release: Accommodation survey: September 2018

Record annual guest nights surpass 40 million – 12 November 2018

Nights spent in short-term commercial accommodation set a new record in the year ended September 2018, surpassing 40 million guest nights for the first time, Stats NZ said today.

Annual guest nights exceeded 30 million in the year ended July 2004, and were over 20 million in the year ended June 1997, when annual records began.


“Since guest nights reached 30 million 14 years ago, hotels have led the growth, accounting for more than a third of all guest nights in 2018,” accommodation statistics manager Melissa McKenzie said.

“Annually, guests spent more nights in hotels than motels for the first time in 2008, when motel nights dipped during the global financial crisis. Since then hotels have consistently been the largest provider of short-term commercial guest nights in New Zealand.”

Annual guest nights in Queenstown–Lakes district grew the most in the last 14 years. Following the Canterbury earthquakes (2010/11), Queenstown–Lakes district took over from Christchurch as the second largest territorial authority area for guest nights.

“Guest nights spent in Queenstown–Lakes district are now approaching levels seen in central Auckland,” Ms McKenzie said.

In the month of September 2018, total guest nights rose 2.9 percent, compared with September 2017.

The Accommodation Survey collects data for guests staying in short-term commercial accommodation such as hotels, motels, backpackers, and holiday parks. Hosted and private accommodation, such as bed and breakfasts and holiday homes, are excluded.

For more information about these statistics:

Building consents for townhouses, flats, and units reach new high – Stats NZ Media and Information Release: Building consents issued: September 2018

Building consents for townhouses, flats, and units reach new high – 31 October 2018

A record 6,059 new townhouses, flats, and units were consented to be built in the year ended September 2018, Stats NZ said today.

This figure was up 29 percent from the previous September year.

“The annual number of townhouses, flats, and units consented has risen steadily since late 2012, coming off historically low levels,” construction statistics manager Melissa McKenzie said.

“Growth in new townhouses, flats, and units between 2013 and 2016 was driven by activity in both Auckland and Canterbury, but more recently it was driven by Auckland.”

In the year ended September 2018, 32,548 new homes were consented nationally, up 5.4 percent from the September 2017 year. Of this national total, 12,945 were consented in the Auckland region.

The new homes consented nationally over the past year were:

  • 20,692 stand-alone houses – down 2.4 percent from the September 2017 year
  • 6,059 townhouses, flats, and units – up 29 percent, to a new series high
  • 3,825 apartments – up 21 percent
  • 1,972 retirement village units – up 6.3 percent.


In September 2018, the seasonally adjusted number of new dwellings consented fell 1.5 percent compared with August 2018, following a 6.8 percent rise in August, and a 9.7 percent fall in July.

For more information about these statistics:
Household incomes up over 40 percent from 2008 – Stats NZ Media and Information Release: Household income and housing-cost statistics: Year ended June 2018

Household incomes up over 40 percent from 2008 – 30 October 2018

The average annual household income has risen 41 percent since 2008, up more than twice the rate of inflation, Stats NZ said today.

Over the same period, average annual housing costs increased 43 percent.

“Although average household income grew 41 percent over the last decade, individual households experienced this growth differently,” labour market and household statistics senior manager Jason Attewell said. “While income for the poorest tenth of households grew 29 percent, for the richest tenth, income grew 47 percent.”

From 2008, the average annual household income rose just over $30,000 (41 percent), to reach $105,719 (before tax) in 2018. Over the same period, average annual housing costs increased 43 percent, from $11,967 to $17,122, according to the latest household income and housing-cost statistics. Inflation as measured by the consumers price index increased 17 percent over the same period.

Household income includes any income from wages and salaries, self-employment, investments, government benefits, and superannuation. Housing costs include rent and mortgages, property rates, and building-related insurance.

Housing costs to income ratio remains unchanged from 2008

For the year ended June 2018, households spent an average of $16.30 of every $100 of their household income on housing costs. This is relatively unchanged from the $16 they spent a decade ago.

“Although the ratio of housing costs to household income hasn’t changed significantly over the last decade, certain types of households, such as renters and poorer households, pay a higher proportion of housing costs,” Mr Attewell said.  

For the year ended June 2018, 1 in 5 (21 percent) of renting households spent 40 percent or more of their household income on housing costs, including rent. This compared with 7.5 percent of homeowners who spent that much of their household income on housing costs, including mortgages.

“The ratio of housing costs to household income is an important measure, because a high proportion of housing costs is often associated with financial strain, particularly for lower-income households,” Mr Attewell said.

For the year ended June 2018, the average weekly housing cost was $338.60 – almost unchanged from 2017.  This included building insurance, which increased significantly from $30.60 per week to $34.10 – an 11 percent increase.

Since the February 2011 Christchurch earthquake, spending on building insurance has more than doubled from $16.60 per week in 2011 to $34.10 in 2018.


For more information about these statistics:

Stats NZ seeks views on what constitutes housing quality – Stats NZ Media Release

Stats NZ seeks views on what constitutes housing quality – 17 October 2018

A public consultation on what constitutes housing quality began today, Stats NZ said.

Feedback is being sought on a proposed housing quality conceptual framework, co-designed by Stats NZ, the Ministry of Business, Innovation and Employment (MBIE), and the Building Research Association of New Zealand (BRANZ).

“There’s currently no agreed definition of housing quality nationally or internationally,” systems and partnerships general manager Rachael Milicich said.

“It’s a very broad topic, so with this framework we’re aiming to capture an agreed way of thinking about housing quality, with all its different aspects and dimensions.”

The housing quality conceptual framework brings together and defines four interrelated elements of housing quality: housing habitability; housing functionality; environmental sustainability; and social and cultural sustainability.

“It’s important to note that we’re looking at housing in relation to people – our communities and whānau – as well as physical structures,” Ms Milicich said.

In the New Zealand data system, frameworks play an important role in developing measures, but they should be broad enough to encompass all the different aspects of a topic, even if not all of them can be easily measured.

Visit Developing a definition for housing quality: Consultation for more information and to make a submission, or email housingqualityframework@stats.govt.nz.

For more information about these statistics:

Construction costs, rents, and rates rise – Stats NZ Media and Information Release: Consumers price index: September 2018 quarter

Construction costs, rents, and rates rise – 16 October 2018

The cost of running a household rose over the year to September 2018, Stats NZ said today.

Housing and household utilities increased 3.1 percent, with increases for construction, rents, rates and electricity. Insurance premiums also rose.

Nationally, local authority rates and payments increased 5.1 percent for the September 2018 year.

“Local authority rates increase in the September quarter each year,” prices senior manager Paul Pascoe said. “However, the rise this year is higher than the 4.2 percent average increase we have seen over the last five years.”

Prices for the purchase of new-built homes increased 4.1 percent in the September 2018 year. The largest increase was in the Rest of South Island (South Island excluding Canterbury), up 7.6 percent. Prices in the Rest of North Island (North Island excluding Auckland and Wellington) rose 6.6 percent over the period.

In Auckland, rising prices for building new homes have slowed recently, up 3.3 percent in the September 2018 year. This compares with an annual price increase of 8.1 percent in the June 2017 year. Over the last five years, the costs for building new homes have increased 37 percent in Auckland, compared with 29 percent across all New Zealand.

Rents increased 2.3 percent in the September 2018 year, down slightly from the 2.5 percent increase in the year to June 2018. The largest increase was in Wellington, which was up 3.8 percent for the September 2018 year and 0.7 percent in the September 2018 quarter. Rents in all regions saw smaller rises in the September 2018 quarter than they have in the last two quarters.

“The average quarterly rent rise reflects many tenants not having an increase, as well as those facing higher costs,” Mr Pascoe said.

Nationally, around 85 percent of properties surveyed had no price change in the September 2018 quarter.

Annual electricity prices rose 2.5 percent in the September 2018 year, after easing slightly in the September 2018 quarter, down 0.2 percent.

Insurance premiums for both dwelling and contents also contributed to the rising cost of running a household. Dwelling insurance was up 16 percent for the September 2018 year, while contents insurance was up 4.3 percent. Quarterly increases in insurance premiums reflect policies being renewed at different times of the year.

Video

View our Consumers price index: September 2018 quarter video.

For more information about these statistics:

Stats NZ Information Release: Dwelling and household estimates: September 2018 quarter

Dwelling and household estimates: September 2018 quarter – 5 October 2018

Dwelling and household estimates provide estimates of all private dwellings in New Zealand at a given date, and estimates of all households usually living in New Zealand at a given date. 

See Dwelling and household estimates: September 2018 quarter on our website or download the attached Excel.

For more information about these statistics:

Hotels, motels, and holiday parks more popular than ever – Stats NZ Media and Information Release: Accommodation survey: August 2018

Hotels, motels, and holiday parks more popular than ever – 10 October 2018

People spent a record number of nights at hotels, motels, and holiday parks in the August 2018 year, but nights spent at backpackers fell, Stats NZ said today.

“Most accommodation types have seen growth in the past year, except for backpackers – where guest nights have fallen,” accommodation statistics manager Melissa McKenzie said.

“Almost 40 million nights were spent at short-term commercial accommodation in New Zealand, in the year ended August,” Ms McKenzie said. “Guest nights spent at hotels have more than doubled in the past 20 years and are now the most popular type of accommodation.”

In the 12 months ended August 2018 compared with the August 2017 year, the number of guest nights were:

  • 14 million at hotels, up 3.6 percent
  • 12 million at motels, up 0.9 percent
  • 8 million at holiday parks, up 6.2 percent
  • 5 million at backpackers, down 1.6 percent.

The areas with the strongest growth in guest nights in the past year were Christchurch, Queenstown-Lakes, and Rotorua. Auckland region’s guest nights fell 1.4 percent following a record August 2017 year.

Hosted and private accommodation, such as bed and breakfasts and holiday homes, are not included in these statistics.

Guest nights up in August month mainly due to North Island

More Kiwis staying in commercial accommodation in the North Island caused guest nights to increase 3.4 percent in the August 2018 month compared with August 2017. This followed a relatively flat August 2017 (down 0.3 percent from August 2016), which was dampened by fewer domestic guest nights in the North Island.

For more information about these statistics: