Stats NZ Report: International Visitor Arrivals to New Zealand: October 2018

International Visitor Arrivals to New Zealand – 26 November 2018

The latest edition of International Visitor Arrivals to New Zealand: October (IVA) is now available on the Stats NZ website.

IVA is a monthly report produced by Stats NZ and sponsored by Tourism New Zealand. It contains detailed tables and graphs of monthly and annual data, showing the number and characteristics of visitor arrivals. IVA provides information in addition to the visitor arrivals information released two working days earlier in the International Travel and Migration: October 2018 release. In particular, airport information released in the IVA is not included in the international travel and migration statistics.

New Zealanders take more overseas trips than ever before – Stats NZ Media and Information Release: International travel and migration: October 2018

New Zealanders take more overseas trips than ever before – 22 November 2018

Over 3 million New Zealand residents arrived back from overseas trips in the year ended October 2018, Stats NZ said today. This was up 175,100 from the October 2017 year.

More and more Kiwis have been taking overseas trips in recent years, with the number growing almost as fast as that for visitor arrivals. Only 10 years ago there were fewer than 2 million trips a year.


Australian school holidays boost visitor numbers

In October 2018, 283,600 visitors arrived in New Zealand, 13,100 more than in October 2017 – led largely by Australia. Visitor arrivals from Australia were up 9.7 percent when compared with October last year.

The largest movements for the month were:

  • Australia (up 9,900)
  • United States (up 3,100)
  • Korea (down 2,200)
  • China (down 1,600).

“More arrivals from Australia was partly due to their school holidays beginning later in September this year than last year,” population insights senior manager Brooke Theyers said.

“More holiday travel in October this year boosted our visitor numbers slightly from the same month in 2017.”

Down month for Asian arrivals

More arrivals from Australia helped compensate for a lower number of visitors from Asia. There were 75,200 visitor arrivals from Asia in October 2018, down 3.7 percent (2,900) from the same month last year.

For recent years Asia has been the fastest growing source region for visitors to New Zealand, which makes October’s fall rather unusual. Despite this fall, for the year ended October 2018 arrivals from Asia were up 8.7 percent (83,100), for a total of 1.04 million visitors.

Departure cards are gone

From 5 November 2018, travellers leaving New Zealand no longer need to complete a passenger departure card. This change affects the release of travel and migration statistics in several ways.

New release schedule

Removing departure cards means changes to the timing and composition of this release. Statistics on short-term movements (including the current report International visitor arrivals to New Zealand) will be published in a new International travel release, and long-term movements in a new International migration release.

Both releases will be published on the same day, up to 30 working days after each reference month. November data, previously published just before Christmas, will now be published in January, and December data in February.

Release calendar

The new release schedule largely reflects the need to use integrated administrative data to provide place-of-residence in New Zealand for migrants and short-term resident travellers. This replaces information from the departure card. The timing is also affected by the new method to produce ‘provisional’ migration estimates.

Integrated Data Infrastructure provides the admin data.

More information

See Migration Data Transformation 

For more information about these statistics:

Net migration is lowest since 2015 – Stats NZ Media and Information Release: International travel and migration: October 2018

Net migration is lowest since 2015 – 22 November 2018

Annual net migration has eased to its lowest level in three years, Stats NZ said today. For the year ended October 2018, it fell to 61,800.

Net migration for the October 2018 month was 6,700, down 1,000 from October 2017.

Overall, net migration was down 8,900 from the October 2017 year, reflecting both fewer migrants arriving in New Zealand and more leaving the country.

For the October 2018 year compared with the October 2017 year:

  • migrant arrivals were 128,100, down 3,500
  • migrant departures were 66,400, up 5,400.


“Although migrant departures continue to be the driving force behind falling annual net migration, October also had a noticeable fall in the number of migrant arrivals,” population insights senior manager Brooke Theyers said.

“Both trends helped bring annual net migration to its lowest level since the year ended September 2015.”


Text alternative for Permanent and long-term migration, year ended October 2018.

Departures for non-New Zealand citizens were 31,800, up 4,400 for the year. Arrivals for non-New Zealand citizens dropped to 96,700, down 2,800.  More New Zealand citizens left the country long-term than returned after living overseas for more than a year – leading to a net loss of 3,100 New Zealand citizens in the 12 months.

Departure cards are gone

From 5 November 2018, travellers leaving New Zealand no longer need to complete a passenger departure card. This change affects the release of travel and migration statistics in several ways.

New release schedule

Removing departure cards means changes to the timing and composition of this release. Statistics on short-term movements (including the current report International visitor arrivals to New Zealand) will be published in a new International travel release, and long-term movements in a new International migration release.

Both releases will be published on the same day, up to 30 working days after each reference month. November data, previously published just before Christmas, will now be published in January, and December data in February.

Release calendar

The new release schedule largely reflects the need to use the Integrated Data Infrastructure to provide place-of-residence in New Zealand for migrants and short-term resident travellers. This replaces information from the departure card. The timing is also affected by the new method to produce ‘provisional’ migration estimates.

Migration estimates

The release in January will fully adopt the outcomes-based measure of migration, first released in May 2017. This measure looks at the travel history of a passenger over a 16-month follow-up period, and classifies a border-crossing according to how long they spent in New Zealand rather than relying on the stated intention on the passenger cards.

Update on the development of provisional external migration estimates

‘Provisional’ migration estimates are a timely measure of migration; they are revised each month until they are finalised after 16 months. Further updates about provisional estimation are planned for late November and December 2018.

‘Final’ migration estimates, based on the ‘12/16-month rule’ and released today on Infoshare, are now updated to June 2017.

Outcomes versus intentions: Measuring migration based on travel histories explains more on the new approach.

More information

See Migration Data Transformation 

Text alternative for Permanent and long-term migration, year ended October 2018

Diagram shows arrivals of non-NZ citizens were 96,700, down 2.8 percent; departures were 31,800, up 16.1 percent; this made a net migration gain of 64,900 non-NZ citizens.

Arrivals of NZ citizens were 31,400, down 2.2 percent; departures were 34,600, up 3.0 percent; this made a net migration loss of 3,100 NZ citizens.

Result is a total net migration gain of 61,800.

Note: Figures may not sum to totals due to rounding. Percentage changes are indicative of the October 2018 year compared with the October 2017 year.

For more information about these statistics:

Asian markets boost visitor arrivals – Stats NZ Media and Information Release: International visitor arrivals to New Zealand: September 2018

Asian markets boost visitor arrivals – 24 October 2018

New Zealand had 258,200 overseas visitor arrivals in September 2018, up 5,400 from the same month last year, Stats NZ said today.

Australia remains New Zealand’s single biggest source of visitors, but an increasing number of visitors came from Asia in September, which is typically a lower season for tourists.

Although nearly half of all visitors in September 2018 were from Australia (123,500), numbers were down 3,500 on September last year.

In contrast, visitor arrivals from Asia were up 5,100 compared with September last year, continuing an ongoing trend. The increased arrivals came from:

  • China (up 1,700)
  • Malaysia (up 1,600)
  • Hong Kong (up 700).

Visitor numbers from the United States were also up 1,800 compared with September last year.

Sydney most popular airport

In September 2018, 65,800 visitors arrived from Sydney, making it the most popular port for flights to New Zealand. Including Sydney, four of the top five source ports for visitor arrivals were in Australia, the others being:

  • Melbourne (44,700)
  • Brisbane (34,700)
  • Coolangatta (13,600).

Hong Kong was the only non-Australian port in the top five, and was the source of 11,100 overseas visitor arrivals in September 2018.

Holidaymakers reach 2 million in September year

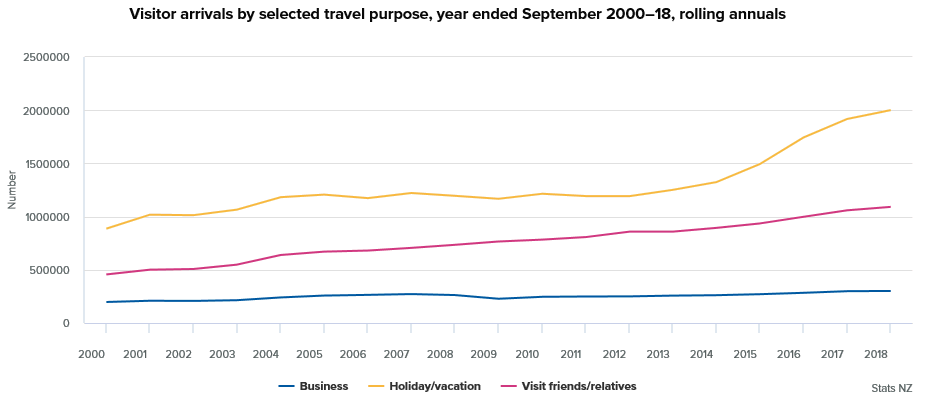
Visitors arriving for the main purpose of a holiday reached 2 million in the year ended September 2018. This was up 83,300 from the year ended September 2017 – the first time a September year has reached this level.

Travelling for a holiday or vacation was the most common reason for visiting New Zealand. Other travel purposes were:

  • visiting friends and relatives (1.09 million)
  • business (301,900)
  • attending conferences/conventions (76,800)
  • education (68,400).

Australia accounted for over half of visitors travelling to visit friends and relatives (577,700).

Total visitor arrivals for the September 2018 year were 3.81 million, up 130,900 from the September 2017 year.

Final days for departure cards

From 5 November 2018, travellers leaving New Zealand will no longer need to complete a passenger departure card (see Final call for travel departure cards). This change will see a full adoption of the outcomes-based measure of migration, first released in May 2017 (see Outcomes versus intentions: Measuring migration based on travel histories).

Update on migration estimates

Stats NZ is also developing provisional migration estimates to maintain timely statistics. An update was published in early October (see Update on the development of provisional external migration estimates) and further updates are planned for November and December.

New release schedule

The removal of the departure card means changes to the timing and composition of the International travel and migration release. Statistics on short-term movements (including the current report International visitor arrivals to New Zealand) will be published via a new ‘International travel’ release, and long-term movements in a new ‘International migration’ release. Both releases will be published on the same day, up to 30 working days after each reference month. November data, previously published just before Christmas, will now be published in January, and December data in February (see Release calendar).

The new release schedule largely reflects the need to use integrated administrative data (ie Stats NZ’s Integrated Data Infrastructure) to provide place-of-residence within New Zealand of migrants and short-term resident travellers. This replaces information from the departure card. The timing is also affected by the new method to produce provisional migration estimates.

For more information about these statistics:

Hotels, motels, and holiday parks more popular than ever – Stats NZ Media and Information Release: Accommodation survey: August 2018

Hotels, motels, and holiday parks more popular than ever – 10 October 2018

People spent a record number of nights at hotels, motels, and holiday parks in the August 2018 year, but nights spent at backpackers fell, Stats NZ said today.

“Most accommodation types have seen growth in the past year, except for backpackers – where guest nights have fallen,” accommodation statistics manager Melissa McKenzie said.

“Almost 40 million nights were spent at short-term commercial accommodation in New Zealand, in the year ended August,” Ms McKenzie said. “Guest nights spent at hotels have more than doubled in the past 20 years and are now the most popular type of accommodation.”

In the 12 months ended August 2018 compared with the August 2017 year, the number of guest nights were:

  • 14 million at hotels, up 3.6 percent
  • 12 million at motels, up 0.9 percent
  • 8 million at holiday parks, up 6.2 percent
  • 5 million at backpackers, down 1.6 percent.

The areas with the strongest growth in guest nights in the past year were Christchurch, Queenstown-Lakes, and Rotorua. Auckland region’s guest nights fell 1.4 percent following a record August 2017 year.

Hosted and private accommodation, such as bed and breakfasts and holiday homes, are not included in these statistics.

Guest nights up in August month mainly due to North Island

More Kiwis staying in commercial accommodation in the North Island caused guest nights to increase 3.4 percent in the August 2018 month compared with August 2017. This followed a relatively flat August 2017 (down 0.3 percent from August 2016), which was dampened by fewer domestic guest nights in the North Island.

For more information about these statistics:

Stats NZ Report: International Visitor Arrivals to New Zealand: August 2018

International Visitor Arrivals to New Zealand

25 September 2018

The latest edition of International Visitor Arrivals to New Zealand: August 2018 (IVA) is now available on the Stats NZ website.

IVA is a monthly report produced by Stats NZ and sponsored by Tourism New Zealand. It contains detailed tables and graphs of monthly and annual data, showing the number and characteristics of visitor arrivals. IVA provides information in addition to the visitor arrivals information released two working days earlier in the International Travel and Migration: August 2018 release. In particular, airport information released in the IVA is not included in the international travel and migration statistics.

First look at provisional external migration estimates – Stats NZ Media Release

First look at provisional external migration estimates – 28 August 2018

Early provisional results of a new approach to measuring external migration are now available, Stats NZ said today.

The results build on the outcomes-based measure of migration that was released in May 2017 and support the removal of the departure card. From November 2018, travellers leaving New Zealand will no longer be required to complete a passenger departure card (see Final call for travel departure cards).

The new approach uses passport data to link arrivals and departures and accurately measure how long people spend in or out of New Zealand after their initial border crossing.

To classify a border crossing as a migrant movement, 16 months of travel history needs to be observed. With the new methodology it will take 17 months before finalised migration estimates are available.

To mitigate the impacts of such a delay, we are developing a statistical model that gives provisional estimates of migration to give a timelier statistic. The first provisional migration estimates are now available.

“Preliminary data presented today gives our customers their first glimpse of what migration statistics will look like once the outcomes-based approach becomes the official way we measure migration in New Zealand,” population insights senior manager Brooke Theyers said today.

The following graphs show provisional estimates from March 2018 back to January 2017, and the final estimates from December 2016 back to January 2016. The latter estimates are final because sufficient time has passed to classify those migrant border crossings with certainty.

Note: Data presented in the following three graphs are indicative only and may differ from published results. Data should be treated with caution as we refine the new methodology and then implement a final production system.

Figure 1


Text alternative for Provisional and final migration estimates

Figure 2


Text alternative for Provisional and final net migration estimates

The bars either side of the median estimates in figures 1 and 2 are uncertainty bounds, which indicate the level of confidence in the estimate. Uncertainty bounds will be given in all future releases of provisional migration estimates. Uncertainty is higher in more recent months because we know less about what travellers did after their initial border crossing.

“As time passes and we get more information about what travellers have done since their initial crossing, we are more certain about the overall level of migration,” Mrs Theyers said.

“After around five months we can classify over 80 percent of crossings with certainty.”

Figure 3

We will revise our estimates each time new migration data are released to include the latest information. Months where the uncertainty is high are subject to larger revisions, while months with low uncertainty will have smaller revisions. Final migration estimates (where every border crossing can be classified with certainty) will not be revised.

More detail on the level of revisions will be released as it becomes available. This includes how results for a given month will change from an initial provisional estimate to a final estimate. See Outcomes versus intentions: Measuring migration based on travel histories for comparisons to intentions-based permanent and long-term figures.

Data in CSV format is available

If you are interested in obtaining provisional migration estimates data in CSV format, or have any questions regarding provisional migration estimates, please contact: demography@stats.govt.nz.

Ends

For media enquiries contact: Kim Dunstan, Christchurch, 03 964 8330, info@stats.govt.nz

The Government Statistician authorises all statistics and data we publish.

Text alternative for figure 1 Provisional and final migration estimates

A time series bar graph has three lines of discrete bars showing arrivals, departures and net migration numbers from January 2016 to March 2018. Each bar has uncertainty bounds to show the level of confidence in the estimate. There are bounds for 95 percent uncertainty and 50 percent uncertainty. Data before January 2017 is final, while data from January 2017 onwards is provisional.

Text alternative for figure 2 Provisional and final net migration estimates

A time series bar graph has discrete bars showing net migration numbers from January 2016 to March 2018. Each bar has uncertainty bounds to show the level of confidence in the estimate. There are bounds for 95 percent uncertainty and 50 percent uncertainty. Data before January 2017 is final, while data from January 2017 onwards is provisional.

For more information about these statistics:

New measure for migration with departure of passenger cards – Stats NZ Media Release

New measure for migration with departure of passenger cards – 27 August 2018

The way migration data is collected and supplied is changing, Stats NZ said today.

The Government has announced that from November, travellers leaving New Zealand will no longer be required to complete a passenger departure card.

Historically, New Zealand’s tourism and migration data has been partly based on information given by travellers as they leave the country, including how long they will be away and where they will spend that time.

Moving to an outcomes-based measure, based on actual movements rather than stated intentions, will allow us to collect more robust and accurate data. An outcomes measure has been published since May 2017 but will now become the official measure.

“Ultimately, this approach will give us a clearer picture of actual migration patterns in New Zealand,” population insights senior manager Brooke Theyers said.

The new measure links actual departures and arrivals using passport data to create travel histories for passengers, which in turn will be used to classify migrant movements.

Moving to the new methodology means it will be 17 months before final migration estimates are available. That’s because someone has to be in the country for 12 months out of 16 before they can be classified as a long-term migrant.

“A delay of that length would have been unacceptable to those who rely on migration data for planning and analysis, so we are developing a statistical model that will provide a provisional estimate of migration. A first look at provisional external migration estimates will be released tomorrow,” said Mrs Theyers.

In future, statistics for New Zealanders travelling overseas will be largely based on when they return. Some variables – including occupation and country of next residence – will no longer be available.

Stats NZ has collaborated with MBIE and Customs to bring about the removal of departure cards.

See also Final call for travel departure cards, released by the Government 26 August 2018.

For more information about these statistics:

More visitors from Australia in July – Stats NZ Media and Information Release: International visitor arrivals to New Zealand: July 2018

More visitors from Australia in July – 23 August 2018

More visitors arrived from Australia in July compared with the same month in 2017, Stats NZ said today.

The increase in visitors from Australia in July coincided with the ski season in New Zealand. It also brought the total number of visitors to New Zealand in July 2018 to 250,500, up 3,600 from July 2017.

Total visitor numbers were up 1.4 percent from the same month last year with the biggest changes from:

  • Australia up 3,600 to 122,000
  • United Kingdom down 2,800 to 8,300
  • United States up 900 to 16,200.

“The drop from the UK reflects the continuing effects seen last month, reversing the boost seen in 2017 as a result of the Lions rugby tour,” population insights senior manager Brooke Theyers said.

Ski season sparks surge in holidaymakers

Holidaymaking was the most popular travel purpose in July 2018, up 4,000 to 122,100 from July 2017.


Australia led the increase in holidaymakers, up 3,800 to 57, 500. This coincided with the ski season in New Zealand, some big South Island ski fields opening earlier than usual, and their recent promotional efforts across the Tasman.

There were 51,100 visitors from Australia who flew into Queenstown and Christchurch airports in July, compared with 48,400 in July last year.

Annual visitor numbers up 3.6 percent

Visitor arrivals for the year ended July 2018 were up 3.6 percent (133,200) to 3.79 million. By region, New Zealand had the most number of visitors from Oceania (dominated by Australia) at 1.64 million (up 22,700). Changes in the number of visitor arrivals from other regions were:

  • Asia up 98,300 to 1.03 million, led by China (up 47,800)
  • Europe down 10,900 to 560,900, led by the United Kingdom (down 14,000)
  • Americas up 27,900 to 471,500, led by the United States (up 14,600)
  • Africa and the Middle East up 1,100 to 50,700, led by Saudi Arabia (up 400).

For more information about these statistics:

Annual net migration eases but rate still high – Stats NZ Media and Information Release: International travel and migration: July 2018

Annual net migration eases but rate still high – 21 August 2018

Annual net migration decreased by 8,600 for the July 2018 year, down from the record high of 72,400 a year ago, Stats NZ said today.

“Even though annual net migration is lower than a year ago, it is still high by historical standards,” population insights senior manager Brooke Theyers said.

The decrease was mainly driven by more non-New Zealand citizen migrants leaving the country, after being in New Zealand for at least a year.

Non-New Zealand citizen migrant departures were up 20 percent from the July 2017 year to 31,300.

Annual net migration in the July 2018 year was 63,800.  Migrant arrivals were 129,000 and migrant departures were 65,200.


Text alternative for Permanent and long-term migration, year ended July 2018

High net migration rate

New Zealand’s current gain from net migration for the June 2018 year equates to 13 people per 1,000 population.  Similar net migration rates were also experienced in the early 2000s.

“The more recent net migration rates are high for New Zealand and high by international standards,” Mrs Theyers said.

“Smaller countries like New Zealand and Ireland tend to have larger swings in net migration rates simply because they have a small population. In contrast, countries with large populations tend to have low net migration rates.”

Germany had a net migration rate of 14 in 2015. Given its population of about 82 million then, this equated to net migration of over 1.1 million people in that year.

New Zealand’s current migration rate is almost four times as high as the United Kingdom and the United States. Both had a net migration rate of 3.4 people per 1,000 population in the June 2017 year.


Outcomes-based net migration updated

An update to the outcomes-based measure of migration (the ‘12/16-month rule’) released today on Infoshare brings the series forward to March 2017. This measure looks at the travel history of a passenger over a 16-month follow-up period, and assigns a classification depending on how long they spent in New Zealand.

To allow for a timelier statistic, Stats NZ has been developing provisional migration estimates, early results of which will be available next week. This will allow Stats NZ to transition from the intentions-based approach to the outcomes-based approach.

The Government Statistician authorises all statistics and data we publish.

Text alternative for Permanent and long-term migration, year ended July 2018

Diagram shows arrivals of non-NZ citizens 97,300 down 0.3 percent; and departures of non-NZ citizens 31,300 up 1.3 percent make net migration gain of non-NZ citizens 66,000.

Arrivals of NZ citizens 31,700 down 0.6 percent and departures of NZ citizens 33,900 up 0.8 percent make net migration loss of NZ citizens -2,200.

Result is total net migration of 63,800.

Note: Figures may not sum to totals due to rounding. Percentage changes are indicative of the July 2018 year compared with the June 2018 year.

For more information about these statistics: