Visitor numbers boosted by Asia-Pacific region – Stats NZ Media and Information Release: International travel and migration: August 2018

Visitor numbers boosted by Asia-Pacific region

21 September 2018

Visitor numbers for August 2018 were up 5.4 percent from August 2017, Stats NZ said today.

There were 246,700 visitor arrivals in August 2018, 12,700 more than for August 2017. The biggest changes were:

  • Australia up 3,100 to 114,400
  • China up 2,300 to 31,500
  • Malaysia up 1,200 to 5,600.

Visitor arrivals increased across every region in August 2018. Arrivals from the Asia region increased the most, up 5,100 (or 7.6 percent) from August 2017. Changes in other regions were:

  • Oceania (Australia and the Pacific) up 5,000 (4.1 percent)
  • Americas up 1,700 (9.7 percent)
  • Europe up 600 (2.8 percent)
  • Africa and the Middle East up 200 (6.7 percent).

For the year ended August 2018, visitor arrivals were up 133,100 (3.6 percent) to 3.8 million.

Travel at a glance

The two maps use travel data to show the top source countries for visitor arrivals to New Zealand and top destinations for New Zealand-resident travellers. They illustrate the key travel interactions between New Zealand and the rest of the world.


Table 3 of International travel and migration: August 2018 (Excel) has the figures for the map Top 30 source countries of overseas visitors to New Zealand.

Visitors arrive in New Zealand from all over the globe, but more come from Australia than anywhere else. Australia accounted for 39 percent of all visitor arrivals in the August 2018 year.


Table 5 of International travel and migration: August 2018 (Excel) has the figures for the map Top 30 destination countries for New Zealand-resident travellers.

Although Australia dominates as a destination for Kiwi travellers, our Pacific neighbours are also popular travel destinations.

Tourism and migration visualiser shows a more detailed breakdown of arrivals and departures, and migration information. Use this tool to analyse travel data for any country.

For more information about these statistics:

Net migration eases back towards 2015 level – Stats NZ Media and Information Release: International travel and migration: August 2018

Net migration eases back towards 2015 level – 

21 September 2018

Annual net migration was down 8,800 (to 63,300) in the August 2018 year when compared with the August 2017 year, Stats NZ said today.

This is the lowest August year since 2015. Net migration is continuing to ease from the record high of 72,400 in the year ended July 2017.

Migrant arrivals were 129,100 and migrant departures were 65,800 for the latest year.


“The number of migrant arrivals in August was only slightly lower than in August 2017, so it was the increase in the number of departures that led to the fall in net migration.” population insights senior manager Brooke Theyers said.

“This is consistent with what we’ve seen in previous months, with the fall in net migration being driven more by increases in migrant departures than decreases in migrant arrivals.”

Migrant departures to Australia still historically low

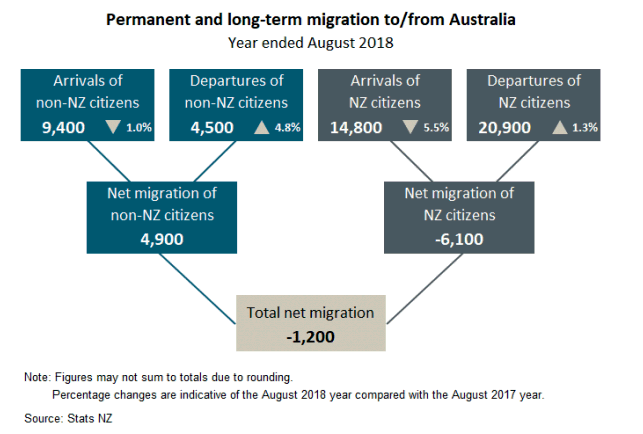
Migrant departures for New Zealand citizens were up 600 for the year ended August 2018, to 34,200. Of these, 20,900 were to Australia.

This increase in departures was accompanied by a fall in the number of citizens returning to New Zealand from Australia, which led to a net outflow of 1,200 migrants.


Text alternative for Permanent and long-term migration to/from Australia, year ended August 2018.

“New Zealand’s net migration with Australia is typically negative so dropping below zero is not unusual.” Mrs Theyers said.

“Historically, New Zealand citizen departures have been much higher. For example, in 2012 there were 48,700 New Zealand citizens who departed to Australia, which led to a net migrant loss of 40,000.”

Both 2016 and 2017 had small positive net migration gains with Australia, due to low numbers of New Zealand citizen departures and record numbers of New Zealand citizens arriving (expats returning home).


Departure cards taking flight

From November 2018, travellers leaving New Zealand will no longer need to complete a passenger departure card. This change means the outcomes-based measure of migration, first released in May 2017, will be fully adopted.

To maintain timely statistics, Stats NZ is developing provisional migration estimates; early results were published in August 2018. More information on the statistical model to produce provisional estimates will be published in early October 2018.

Final call for travel departure cards

Defining migrants using travel histories and the ’12/16-month rule’

First look at provisional external migration estimates

Text alternative for Permanent and long-term migration to/from Australia, year ended August 2018

Diagram shows permanent and long-term migration to/from Australia. Arrivals of non-NZ citizens were 9,400, down 1.0 percent; departures of non-NZ citizens were 4,500, up 4.8 percent; this makes the net migration gain of non-NZ citizens 4,900.

Arrivals of NZ citizens were 14,800, down 5.5 percent; departures of NZ citizens were 20,900, up 1.3 percent; this makes the net migration loss of NZ citizens -6,100.

Result is total net migration of -1,200.

Note: Figures may not sum to totals due to rounding. Percentage changes are indicative of the August 2018 year compared with the August 2017 year.

The Government Statistician authorises all statistics and data we publish.

For more information about these statistics:

New Zealand Gross domestic product: June 2018 quarter – Data Sets and Analysis

Gross domestic product: June 2018 quarter – 20 September 2018, 10:45am

Gross domestic product (GDP) provides a snapshot of the performance of the economy. GDP is New Zealand’s official measure of economic growth.

Key facts

  • New Zealand economy grew 1.0 percent in the June 2018 quarter.
  • Broad-based growth, with 15 of 16 industries up.
  • Agriculture, forestry, and fishing was up 4.1 percent.
  • Mining was down 20 percent.
  • Investment spending was down 0.1 percent.
  • GDP per capita was up 0.5 percent.
  • Real gross national disposable income was up 0.8 percent.

New Zealand economy grows 1.0 percent

Economic activity, as measured by gross domestic product (GDP), was up 1.0 percent in the June 2018 quarter. This rise follows a 0.5 percent increase in the March 2018 quarter.

GDP grew 2.7 percent over the year ended June 2018.

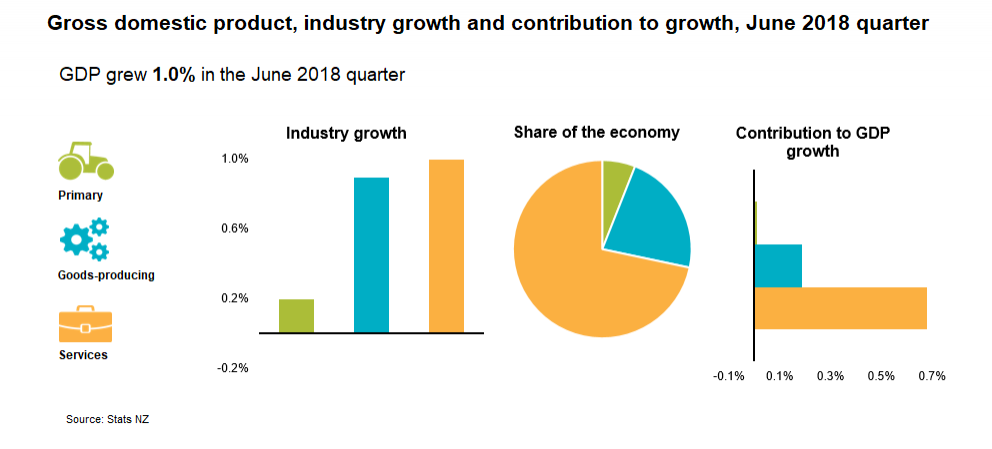
Growth across 15 of the 16 industries contributed to the largest quarter-on-quarter increase in two years. A 1.0 percent increase in the service industries was the biggest contributor to growth this quarter. The goods-producing industries were up 0.9 percent following a flat March 2018 quarter. The primary industries grew 0.2 percent, with strong growth in agriculture, forestry, and fishing offset by a significant fall in mining.

Image, GDP industry growth and contribution to growth, June 2018 quarter

Text alternative for Gross domestic product, industry growth and contribution to growth, June 2018 quarter

All service industries up

The 1.0 percent growth in the service industries was broad-based in the June 2018 quarter, with all 11 of the service industries growing. Growth in the retail trade and accommodation, wholesale trade, and transport industries was helped by a combination of increased household spending (up 1.0 percent after a flat March 2018 quarter) and strong international spending.

Industry$(million)Seasonally adjusted chain-volume series expressed in 2009/10 prices.Gross domestic product by industry, change from March 2018 quarterAgriculture, forestry, and fishingMiningManufacturingElectricity, gas, water, and waste servicesConstructionWholesale tradeRetail trade and accommodationTransport, postal, and warehousingInformation, media, and telecommunicationsFinancial and insurance servicesRental, hiring, and real estate servicesBusiness servicesPublic administration and safetyEducation and trainingHealth care and social assistanceArts, recreation, and other services-175-150-125-100-75-50-250255075100125150Stats NZ

Agriculture, forestry, and fishing up, but mining down

Favourable weather conditions boosted milk production, which led to a 4.1 percent increase in agriculture, forestry, and fishing in the June 2018 quarter. The increase in milk production comes after consecutive quarters of favourable rainfall and is reflected by increases to both dairy manufacturing and dairy exports in the June 2018 quarter.

Growth in agriculture, forestry, and fishing was further supported by increases in sheep and beef cattle farming, reflected in higher meat exports for the quarter. Meat prices rose 3.6 percent to reach historically high levels. Horticulture and fruit growing, and forestry were also up in the quarter.

The strong growth in agriculture, forestry, and fishing was offset by a 20 percent drop in mining in the June 2018 quarter. The fall – the largest for the industry since 1989 – resulted from an unplanned outage at New Zealand’s largest natural gas field, the Pohokura field, after a leaking pipeline was discovered in March.

PercentSeasonally adjusted chain-volume series expressed in 2009/10 prices.Mining industry growth rates, June 2012 quarter to June 2018 quarterQuarterly growth (%)Annual growth (%)Jun-12Sep-12Dec-12Mar-13Jun-13Sep-13Dec-13Mar-14Jun-14Sep-14Dec-14Mar-15Jun-15Sep-15Dec-15Mar-16Jun-16Sep-16Dec-16Mar-17Jun-17Sep-17Dec-17Mar-18Jun-18-30-20-1001020Stats NZ

A fall in petroleum and chemical manufacturing partly reflects downstream effects of the Pohokura outage, as reduced gas supply led to Methanex halting their operations. This is in conjunction with an expected drop due to the planned shutdown of the Marsden Point refinery for maintenance.

Goods-producing industries resume growth

Goods-producing industries rose 0.9 percent in the June 2018 quarter as electricity and construction each rebounded from falls in the March 2018 quarter. Electricity generation provided the biggest contribution, with above-average hydro lake levels and greater household consumption powering a 3.7 percent increase.

Total manufacturing rose 0.4 percent, with increased transport equipment manufacturing offsetting the fall in petroleum and chemical product manufacturing.

Food manufacturing rose 0.6 percent, with higher dairy and meat manufacturing held back by a fall in beverage and tobacco manufacturing. The fall in beverage and tobacco manufacturing follows a 9.3 percent rise in the March 2018 quarter after large tobacco imports in the December 2017 quarter.

Investment down 0.1 percent

Overall gross fixed capital formation was down 0.1 percent, and business investment (all investment less residential construction) was down 0.2 percent. Residential construction investment increased 0.5 percent, and telecommunication infrastructure investment helped boost other construction. There were also notable increases in investment in transport equipment and software.

Offsetting these increases was a 1.3 percent fall in plant, machinery and equipment investment. This fall follows six consecutive quarters of increase, with growth for the year ended June 2018 up 13 percent.

GDP per capita

When comparing GDP growth to population change, GDP per capita rose 0.5 percent in the June 2018 quarter. This follows a flat March 2018 quarter. For the year ended June 2018, GDP per capita was up 0.7 percent.

Real purchasing power of New Zealand’s income up 0.8 percent

New Zealand’s ability to buy goods and services from its income improved in the June 2018 quarter. Real gross national disposable income (RGNDI), which measures the real purchasing power of the country’s disposable income, was up 0.8 percent in the quarter.

Annually, RGNDI was up 3.1 percent.

Seasonally adjusted chain-volume series expressed in 2009/10 prices.Real gross national disposable income, quarterly and annual growth rates, June 2012 quarter to June 2018quarterQuarterly growth (%)Annual growth (%)Jun-12Sep-12Dec-12Mar-13Jun-13Sep-13Dec-13Mar-14Jun-14Sep-14Dec-14Mar-15Jun-15Sep-15Dec-15Mar-16Jun-16Sep-16Dec-16Mar-17Jun-17Sep-17Dec-17Mar-18Jun-18-2.502.557.5Stats NZ

With a population increase of 0.4 percent over the June 2018 quarter, RGNDI per capita rose 0.4 percent as our real purchasing power increased by more than the rate of growth in our population. Over the June 2018 year, RGNDI per capita increased 1.1 percent.

RGNDI measures the volumes of goods and services that New Zealand residents have command over while GDP measures economic activity. RGNDI is also affected by changes in the terms of trade, as well as the country’s net investment income and net transfer flows with the rest of the world.

GDP growth of 1.0 percent in the June 2018 quarter, coupled with a 0.6 percent rise in the terms of trade, outweighed a slightly larger net flow of income overseas to produce a 0.8 percent rise in RGNDI. The larger net flow of income overseas was a result of the worsening net transfers flow more than offsetting a small improvement in the net investment income flow.

The terms of trade is the ratio of the price of exports to the price of imports. An increase in the terms of trade occurs when export prices rise by more than import prices and result in fewer exports being needed to pay for a given volume of imports. This means residents can purchase a larger volume of goods and services from the incomes generated from a given level of domestic production.

See Overseas trade indexes (prices and volumes): June 2018 quarter (provisional) for terms of trade export and import price movements

See Balance of payments and international investment position: June 2018 quarter for information on net investment income and transfer flows.

See Real gross national disposable income in DataInfo+ for more information about RGNDI.

International growth comparison – New Zealand compared with trade partners

Percentage changes in GDP – international comparisons
 Country Quarterly percentage change in GDP Change from same quarter previous year
New Zealand 1.0 2.8
Australia 0.9 3.4
 Canada 0.7 1.9
Euro area (19 countries) 0.4 2.1
Japan 0.7 1.3
OECD 0.6 2.5
United Kingdom 0.4 1.3
United States 1.0 2.9


See OECD.Stat for GDP data covering other countries. Care should be taken when comparing New Zealand’s GDP figures with those of other countries, as the methodology used varies internationally.

Revisions

We incorporated several revisions in this release. Revisions reflect new or improved data that affect historical results, or changes to the underlying measure. In both cases we aim to better represent the real-life situation of a changing society, economy, and environment.

See DataInfo+ for more information.

Broad-based growth as GDP rises 1 percent in June quarter – 20 September 2018, 10:45am

Broad-based growth as GDP rises 1 percent in June quarter – 20 September 2018, 10:45am

Gross domestic product (GDP) rose 1.0 percent in the June 2018 quarter, up from 0.5 percent last quarter, Stats NZ said today. This is the largest quarterly rise in two years.

Growth was broad-based, with 15 of 16 industries recording higher production. Mining was the only industry to decline, reflecting one-off factors.

“Once again service industries led growth. Goods-producing and primary industries also saw rises this quarter,” national accounts senior manager Susan Hollows said.

The largest contribution to growth came from agriculture, up 4.2 percent.

Growth of 1.0 percent in the service industries was broad-based, with all industries recording a lift.

“The real strength of services this quarter lay in a consistent performance across a range of industries,” Mrs Hollows explained.

Retail trade and accommodation, wholesale, and transport industries all rose, reflecting higher household spending.

Within primary industries, agriculture’s strong performance was supported by growth in forestry. A 20 percent fall in mining – its largest fall in 29 years – provided a strong offset.

“Quarterly growth in agriculture was the strongest since September 2014, with the dairy season ending well after earlier weather disruptions,” Mrs Hollows said. “An unplanned shutdown stalled gas production, which led to the fall in mining as well as some offset to manufacturing activity.”

Manufacturing was further affected by lower petroleum and chemical product manufacturing following a planned shutdown at Marsden Point refinery.

Growth in electricity generation was the largest in nine years, with wet and cold weather likely to have influenced both production and demand.

Text alternative for Gross domestic product, industry growth and contribution to growth, June 2018 quarter

GDP per capita was up 0.5 percent in the June 2018 quarter, following a flat quarter in March.

Annual GDP growth for the year ended June 2018 was 2.7 percent.

The size of the economy in current prices was $289 billion.

PercentSeasonally adjusted chain-volume series expressed in 2009/10 prices.Gross domestic product, quarterly and annual growth rates, June 2012 quarter to June 2018 quarterQuarterly growth (%)Annual growth (%)Jun-12Sep-12Dec-12Mar-13Jun-13Sep-13Dec-13Mar-14Jun-14Sep-14Dec-14Mar-15Jun-15Sep-15Dec-15Mar-16Jun-16Sep-16Dec-16Mar-17Jun-17Sep-17Dec-17Mar-18Jun-18024-26Stats NZ

Sep-14
● Quarterly growth (%): 1.3
● Annual growth (%): 2.8

Text alternative for Gross domestic product, industry growth and contribution to growth, June 2018 quarter

Diagram has a column graph, pie chart, and bar chart showing growth, share of the economy, and contribution to growth in the June 2018 quarter of the primary, goods-producing, and services industries.

Column chart shows the primary industry grew 0.2 percent, goods-producing 0.9 percent, and services 1.0 percent.

Pie chart shows that services industries make up about two-thirds of GDP, goods-producing about one-fifth and primary about one-twentieth.

Bar chart shows industry contribution to the GDP growth rate: primary 0.0 percentage points, goods-producing 0.2 percentage points, and services 0.7 percentage points.

Part-time workers most likely to lend a hand – Stats NZ Media and Information Release: Labour market statistics (volunteer work): June 2018 quarter

Part-time workers most likely to lend a hand – 18 September 2018

Part-time workers, particularly women and those aged 65 years and older, were the workers most likely to do volunteer work, Stats NZ said today.

“These results from the Household Labour Force Survey are in line with other volunteering data sources,” labour market manager Sean Broughton said.

“We see similar themes across various data sources for volunteer work, but each has a different purpose, context, and collection method.

“This means the data on volunteer work from this survey is not directly comparable with other Stats NZ sources, such as the Time Use Survey and General Social Survey.”

This was the first time questions on volunteer work were included in the Household Labour Force Survey. The data will be collected in the June quarter every two years, with the next being in June 2020.

Volunteer work is non-compulsory, unpaid work performed for others outside a person’s own household or family business.

“This might include volunteering through organisations, such as being a member of your local committee, as well as volunteer work done directly for others, such as mowing your neighbour’s lawn,” Mr Broughton said.

Women working part-time most likely to volunteer

Part-time workers were more likely to do volunteer work than full-time workers. Women who worked part-time were more likely to do volunteer work than men who worked part-time.


Among part-time workers, those aged 65 years and over were more likely to do volunteer work than all other age groups.


Women volunteer more hours

Men accounted for almost 60 percent of paid work hours, with the balance done by women. When it came to volunteering, women did about 60 percent of all volunteered hours.

One-third of all volunteers were people who were not in the labour force, such as retirees and students. However, they did more than 40 percent of total hours volunteered.

Lowest- and highest-paid volunteer most

People who received the least and most (gross) income a week (except those who had no income) from wages and salaries, self-employment, or government transfers had the highest rates of volunteer work. About one-quarter of people who either received a weekly income of less than $500 a week, or received $1,500 or more a week, volunteered.

People who received at least $500 but less than $1,000 a week were more likely to do volunteer work directly for other people than for an organisation. In contrast, those who received $1,500 and over were more likely to do volunteer work for an organisation.

Professionals more likely to volunteer for organisations

People doing paid work in certain occupations and industries were more likely to either volunteer for an organisation or directly for others.

Those whose main paid job was in a professional occupation, such as teachers and nurses, were more likely to do volunteer work for organisations. Similarly, those who worked in the financial and insurance service industry were more likely to do volunteer work for organisations.

Workers in the construction industry were more likely to do volunteer work directly for others.

Caregiving and coaching among most-common activities

The most-common volunteer work was community and personal services, such as caregiving or coaching sports. This was followed by labouring, such as farming or construction activities. These types of volunteer work were more likely to be performed directly for others, rather than for an organisation.

Over 85 percent of all volunteer workers who did organisation-based work did so for a non-profit organisation.

Among non-profit organisations, those related to culture, sport, and recreation had more volunteer workers than other types of organisations. This was followed by non-profit organisations related to religion.

“These volunteers could be coaching local sports teams or helping at their local church,” Mr Broughton said.

For more information about these statistics:

Half of New Zealanders say te reo Māori should be taught at primary school – Stats NZ Media Release

Half of New Zealanders say te reo Māori should be taught at primary school – 14 September 2018

More than half (53 percent) of New Zealanders say te reo Māori should be a core subject in primary schools, Stats NZ said today.

Data about attitudes to the Māori language was collected for the first time in New Zealand’s biggest survey of well-being – the General Social Survey (GSS) 2016.

“Te reo Māori is recognised as a taonga, or treasure, for all New Zealanders,” labour market and household statistics senior manager Jason Attewell said. ‘‘The GSS survey shows about half of New Zealanders have positive attitudes to te reo Māori.”

Over half (53 percent) of New Zealanders said they strongly agreed or agreed ‘Māori should be a core subject in primary schools’.

The GSS also asked whether ‘Government should encourage and support the use of Māori in everyday situations’. Almost half (49 percent) of adult New Zealanders said they strongly agreed or agreed with this statement.  About 45 percent supported the statement ‘Signage should be both in Māori and English’.  Thirty-five percent strongly agreed and agreed with the statement ‘It would be good if all people living in New Zealand spoke Māori and English’.

Nearly half of New Zealanders had used at least some te reo words or phrases in the previous four weeks

The 2016 GSS also recorded people’s ability to use te reo Māori in day-to-day conversations.

“Only 6 in 100 New Zealanders say they can kōrero i te reo Māori or speak Māori very well, well, or fairly well,” Mr Attewell said. “However, more than half of New Zealanders commonly use te reo words or phrases.”

More than a third of those surveyed said it would be a good idea if all New Zealanders spoke both languages.

‘Very well’ means they can talk about almost anything in te reo, ‘well’ means they can talk about many things, and ‘fairly well’ means they can talk about some things in Māori.

In the 2013 Census, 148,395 people said they spoke Māori, compared with 157,110 in 2006.

Strongest support from New Zealanders aged 15 to 44

Support for te reo was strongest among New Zealanders aged 15–44 years (see graph below).


The 15–44-year age group was more likely to strongly agree or agree with the statements about the Māori language, particularly on using te reo Māori everyday and as a core subject in primary schools. Those aged over 65 were the least likely to support these statements.

E ai ki te kotahi haurua o ngā tāngata o Aotearoa, me whakaako te reo Māori i te kura tuatahi

E ai ki neke atu i te haurua (53 ōrau) o ngā tāngata o Aotearoa, me whakanoho te reo Māori hei kaupapa matua i te kura tuatahi, e ai ki Tatauranga Aotearoa, i tēnei rangi.  

I kohia he raraunga mō ngā waiaro o te tangata mō te reo Māori i te rangahau nui rawa o te toiora o te tangata – te Tirohanga Pāpori Whānui (GSS) o te tau 2016. Kātahi anō ngā tāngata ka uia mō tēnei āhua.

“E whakaponotia ana he taonga te reo Māori mō Aotearoa,” e ai ki te kaiwhakahaere matua mō ngā taunga hunga mahi me te kāingā, a Jason Attewell. “Tā te tirohanga GSS he whakaatu mai kei tōna haurua o ngā tāngata o Aotearoa he whakapai ngā waiaro ki te reo Māori.”

Kei runga ake i te 53 ōrau o ngā tāngata o Aotearoa e kī ana e tino whakaae ana, e whakaae ana rānei ‘me noho ko te reo Māori hei kaupapa matua i ngā kura tuatahi.’

I ui hoki te GSS mehemea ‘me whakatenatena, me tautoko hoki te Kāwanatanga i te whakamahinga o te reo Māori i ngā āhuatanga o ia rā.’ Tata ki te haurua (49 ōrau) o ngā tāngata pakeke o Aotearoa e kī ana e tino whakaae ana, e whakaae ana rānei ki tēnei whakapuaki.  Kei tōna 45 ōrau i tautoko i te whakapuaki ‘Me puta reo rua ngā pānui ki te reo Māori me te reo Pākehā’.  Toru tekau mā rima ōrau e tino whakaae ana, e whakaae ana rānei ki te whakapuaki ‘He mea pai kia mōhio ngā tāngata katoa e noho ana i Aotearoa ki te kōrero i te reo Māori me te reo Pākehā.’

Tata ki te haurua o ngā tāngata o Aotearoa kua whakaputa i ētahi kupu reo Māori, whakapuaki reo rānei i ngā wiki e whā ki muri

I hopu hoki te GSS 0 te tau 2016 i te āhei o te tangata ki te whakamahi i te reo Māori i ngā kōrerorero o ia rā.

“E 6 noa iho i roto i te 100 tāngata o Aotearoa e kī ana, ka āhei rātou te kōrero i te reo Māori, he tino kaha, he kaha, he āhua kaha hoki ki te kōrero Māori” ki tā Attewell. “Ahakoa rā, neke atu i te haurua o ngā tāngata o Aotearoa he whakamahi i ngā kupu me ngā kīanga reo Māori.”  

Neke atu i te hautoru o te hunga i uia i kī, he whakaaro pai kia kōrero ngā tāngata katoa o Aotearoa i ngā reo e rua.

Te tikanga o “tino kaha” ka taea te kōrero mō ngā mea katoa ki te reo, te tikanga o “kaha” he mōhio ki te kōrero mō ngā mea maha, te tikanga o “āhua kaha” ka taea te kōrero mō ētahi āhuatanga ki te reo Māori.

I te Tatauranga 2013, 148,395 ngā tāngata i kī, e kōrero Māori ana rātou, hei whakaritenga ki tōna 157,110 tāngata i 2006.

Ko te tino tautoko pakari nā ngā tāngata o Aotearoa i waenga i te 15 ki te 44 tau te pakeke

I tino kaha rawa te tautoko o te reo e te hunga o Aotearoa i waenga i te 15-44 tau te pakeke (tirohia te kauwhata i raro iho nei).  


Ko te reanga 15-44 tau te rōpū i tino whakaae, i whakaae rānei ki ngā whakapuaki mō te reo Māori, otirā mō te whakamahinga i te reo Māori ia rā, hei kaupapa matua hoki i ngā kura tuatahi. Ko ērā kei runga ake i te 65 tau te hunga ka taea te matapae kāore e tautoko i ēnei whakapuaki.

Ngā uiui a te hunga pāpāho
For more information about these statistics:


Brisk weather brings broccoli prices down – Stats NZ Media and Information Release: Food price index: August 2018

Brisk weather brings broccoli prices down – 13 September 2018

Broccoli prices fell 27 percent in August 2018, and 32 percent for the year, Stats NZ said today.

These price decreases contributed strongly to the overall fall of monthly and annual food prices.

“Broccoli is grown all year round, but is typically cheapest in December, at about $1.50 a head,” prices manager Geraldine Duoba said. “The cool weather this winter provided ideal growing conditions for broccoli.”

The average price of a 350g head of broccoli was $2.09 in August 2018, down 77 cents from July.  It is also about one-third cheaper than a year ago when prices reached $3.09 per head in August 2017.

Overall, food prices fell 0.5 percent in August, down 0.8 percent after seasonal adjustment. Fruit and vegetable prices fell 2.1 percent in the month, influenced by lower prices for lettuce, broccoli, and cucumber. Grocery food prices, however, rose 0.5 percent, influenced by higher prices for snack foods, butter, and eggs.

Food prices decreased 0.1 percent in the year to August 2018. Fruit and vegetable prices fell 6.5 percent, reflecting lower broccoli, potato, and cucumber prices. This fall more than offset a 2.9 percent increase in restaurant meals and ready-to-eat food prices, which have shown higher than average inflation after the minimum wage increase in April this year.

“Fruit and vegetable prices rose strongly last year due to wet weather, peaking in August 2017,” Mrs Duoba said. “This month prices are closer to those experienced two years ago, in August 2016.”

Video

View our Food price index: August 2018 video.

For more information about these statistics:

Fuel lifts retail card spending in August – Stats NZ Media and Information Release: Electronic card transactions: August 2018

Fuel lifts retail card spending in August – 11 September 2018

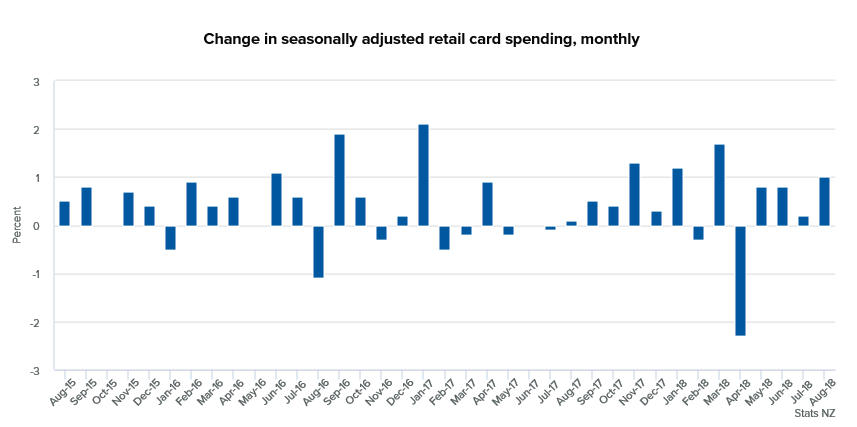
Increased fuel spending by consumers helped lift overall retail card spending in August 2018, Stats NZ said today.

All retail categories increased, with a 1.0 percent rise in total retail card spending when adjusted for seasonal effects.

“Fuel prices rose in August compared with July, contributing to the lift in fuel spending,” retail statistics manager Sue Chapman said. “Fuel spending on electronic cards has generally risen over the last year.”

“Apart from fuel, other retail categories also had increased spending in August,” Ms Chapman added. “This helped lift overall retail spending to its largest monthly rise since March.”

Card spending rose in all six retail industries. The largest movements were for:

  • fuel, up $27 million or 4.1 percent (fuel values for July were revised downwards after receiving updated data)
  • durables, up $15 million or 1.2 percent
  • consumables (grocery and liquor), up $12 million or 0.6 percent.

Core retail spending (which excludes vehicle-related industries) rose 0.7 percent in August 2018, after a 0.3 percent rise in July 2018. This is the fourth consecutive rise in core retail spending.

Actual retail spending using electronic cards was $5.2 billion in August 2018, up $306 million (6.3 percent) from August 2017.

Values are only available at the national level and are not adjusted for price changes.

For more information about these statistics: