Construction and accommodation cement employment growth – Stats NZ Media and NZ.Stat tables Release: Linked employer-employee data: March 2017 year

Construction and accommodation cement employment growth – 28 November 2018

Construction in Auckland has led employment growth in the region, Stats NZ said today. Construction employed 8,000 more people in the year ended March 2017 than in the previous year.

“New analysis from the annual release of linked employer-employee data (LEED), enhanced by self-employment data, allows insights into employment growth by region and industry,” labour market and household statistics senior manager Jason Attewell said.

Accommodation and food services contributed most to employment growth in the South Island. In Canterbury, 1,300 more people were employed in this industry in the March 2017 year than in the previous year. Rebuild-related construction growth looks to have peaked at 40,000 workers in the year ended March 2016.

Find what’s driving employment growth in your region

Use the interactive mapping tool to select a region and see the industries that led employment growth in your region.

From North to South: the big employers

The importance of construction growth has varied across regions. The figure below, Employment by selected regions and industries, year ended March 2001–17, shows the number of employed persons in four regions (Auckland, Waikato, Canterbury, and Otago) in seven industries.
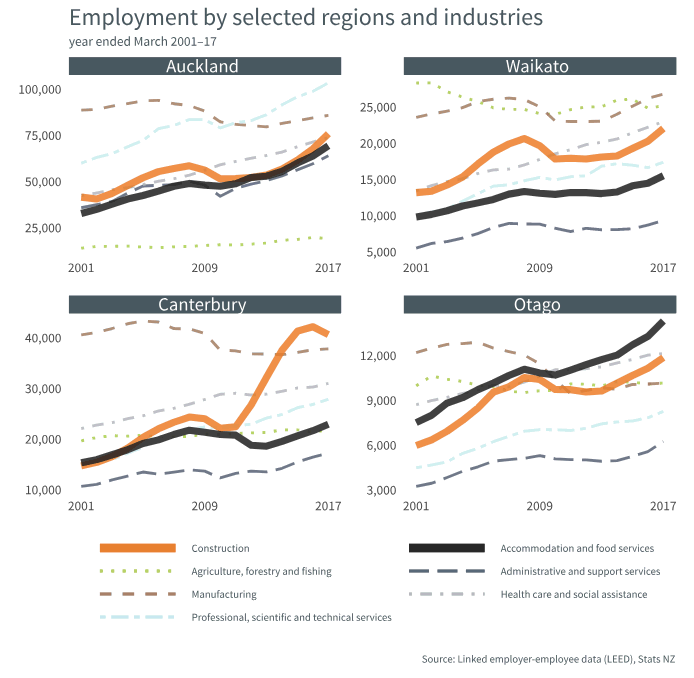
See table 1.5: Main earnings source, by industry for the time series shown in the above figure.

Video

See the Linked employer-employee data: March 2017 year – NZ.Stat tables video.

About the data

The annual LEED release uses tax data for all workers, so it is the most comprehensive employment record available. However, results are about 18-months old by the time they are compiled and published.

LEED is different from the more-timely indicator of the state of employment that the quarterly Labour market statistics provide – its employment levels are based on a sample survey of 15,000 households and 30,000 individuals.

Labour market statistics: September 2018 quarter has the latest employment information.

Download data

NZ.Stat has detailed employment by region data in the annual release of linked employer-employee data (LEED).

For more information about these statistics:

Fuel drives up transport costs – Stats NZ Media and Information Release: Business price indexes: September 2018 quarter

Fuel drives up transport costs – 19 November 2018

The prices that businesses pay for petrol and diesel rose 6.9 percent and 7.0 percent, respectively, in the September 2018 quarter, Stats NZ said today.

This made the latest quarter the fourth in a row with rising fuel costs. Other petroleum products such as aviation fuel and lubricating oils also rose this quarter (up 3.7 percent).

Petrol and diesel costs for businesses rose 22.5 percent and 37.8 percent, respectively, in the year to September 2018. Other petroleum products rose 14.3 percent for the year. Fuel is a major contributor to the costs that businesses pay to produce their goods and services.

Both input and output prices (up 1.4 percent and 1.5 percent, respectively) for businesses showed relatively strong increases in the September 2018 quarter. While a wider or narrower gap between input and output prices affects business profitability, volumes are also a factor.

The transport, postal, and warehousing industry had a 3.1 percent increase in input costs in the latest quarter, affected by the fuel increases. The increase flowed through to customers – output prices these businesses charged for their services rose 2.9 percent this quarter. For postal businesses, maintaining profitability in the face of decreasing mail volumes contributed to this industry’s rise in output prices.

Consumers price index: September 2018 quarter reported transport and petrol increases of 2.4 percent and 5.5 percent, respectively.

Electronic card transactions: September 2018 showed a seasonally adjusted rise of $65 million across the retail fuel industry over the September 2018 quarter.

For more information about these statistics:

Businesses show growth contrasts after 2008 – Stats NZ Media and Information Release: New Zealand business demography statistics: At February 2018

Businesses show growth contrasts after 2008 – 26 October 2018

The number of New Zealand businesses and the number of people they employed went through two contrasting periods in the decade after 2008, Stats NZ said today.

The number of businesses grew more than 12 percent in the five years to 2018 after dipping slightly in the five years after the 2008 global financial crisis (GFC).

“Business demography data for 2009–18 reflects the impact of the GFC and domestic events on New Zealand business counts,” business register manager Mary Reid said.

“Data also reflects the ongoing effect for 2009–13 and how large the recovery was over the following five years.”

Riding rough for five years

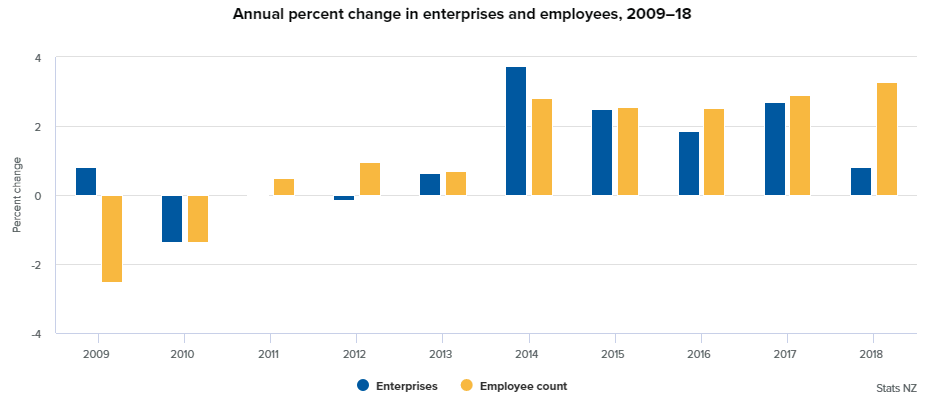
Over the five years immediately following the 2008 GFC, both counts – enterprises and employees – struggled to keep up with their pre-GFC levels. In 2013, there were 0.1 percent fewer enterprises and 1.8 percent fewer employees than in 2008.

In contrast, the five years ended February 2018 showed a recovery. The number of enterprises and employees jumped 12.1 percent and 15.0 percent, respectively – an average annual rise of 2.3 percent for enterprises and 2.8 percent for employees. Annual employment growth each year did not dip below 2.5 percent.

Economic growth – a similar story

The New Zealand economy also had two contrasting growth periods after 2008. The average annual economic growth (based on GDP for March years) for 2009–13 was 1.0 percent. For 2014–18, the average annual growth was around 3.3 percent.

Construction industry leads the pack

In the post-GFC recovery, the construction industry was in the lead. After a 4.4 percent drop in employment between 2009 and 2013, employment rebounded with 34.8 percent growth over the next five years.

Administrative and support services employment dropped just 1.2 percent between 2009 and 2013, then added 27.1 percent more employees over the five years to 2018.

Accommodation and food services had a similar turnaround in employment, recovering from a 3.9 percent drop in the first five years to gain 24.7 percent over the last five years.

Manufacturing – still the largest employer in 2018 – had 11.9 percent fewer employees over the five years after 2008, then a 9.2 percent increase in employment over the next five years.

Health care and social assistance was the only industry that maintained some consistency over the whole 10-year period, with employment gains of 10.3 percent and 11.2 percent over the two five-year periods.

Points to note:

  • Employee count data in business demography statistics is used primarily as a business size measure – not as an official employment statistic.
  • Business demography statistics only cover economically significant enterprises operating in New Zealand. These are mostly those with an annual GST turnover of $30,000 or more.

For more information about these statistics:

Largest monthly trade deficit on record

25 October 2018, 10:45am

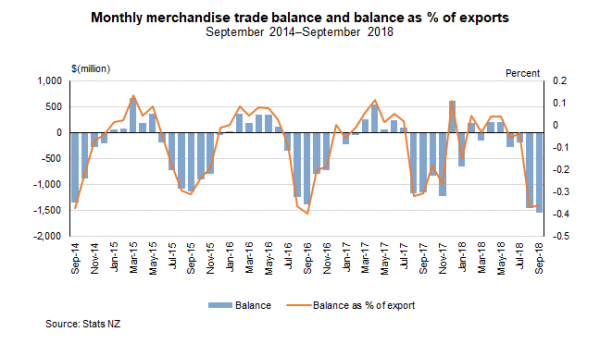
Record imports in September 2018 led to the largest-ever monthly goods trade deficit of $1.6 billion, Stats NZ said today.

This is the second month in a row showing a record monthly trade shortfall.

In September 2018, imports rose $930 million (19 percent) on the same month last year to reach $5.9 billion, the highest value for total imports on record.

Exports were up $536 million (14 percent) to reach $4.3 billion.

Text alternative for Merchandise trade balance – monthly values and balances as % of exports

September months usually show a trade deficit because it is a low point in the export season for key products such as dairy and meat. The last surplus for a September month was in 1991. The September 2018 deficit was equal to almost 40 percent of exports for the month (see monthly merchandise trade balance graph).

The Reserve Bank trade weighted index (TWI) (measuring the New Zealand dollar against the currencies of other key trading partners) has been falling since August 2017 when compared with the same month of the previous year. The TWI is now 5.4 percent lower than at September 2017.

“This month’s record imports continue the high values seen since May 2018,” international statistics manager Tehseen Islam said. “The monthly imports value has been more than $5 billion for the past five months, in part reflecting high prices for imported fuel and crude oil.”

Petroleum and products lead imports rise

The leading contributor to the rise in total imports were petroleum and products, up $366 million (87 percent) from September last year. This increase was led by crude oil (up $278 million) and fuels (up $86 million).

Imports of crude oil and other petroleum products tend to fluctuate from month to month. The increase in crude oil import values this month reflected higher prices as volumes fell 1.9 percent from September 2017.

Imports of aircraft and parts also rose in September 2018, up $266 million. Aircraft imports are irregular and can mean one-off rises or falls in monthly figures.

Kiwifruit leads exports rise

The leading contributor to the rise in total exports was fruit, up $188 million (118 percent). This increase was led by gold kiwifruit, up $122 million, and green kiwifruit, up $62 million.

$Export values ($) of kiwifruit to top destinations, September 2018 and September 201720172018China – gold kiwifruitJapan – gold

Exports of gold kiwifruit in September 2018 were worth $140 million, up sharply compared with the same month in 2017 and 2016. This increase reflects both higher production volumes and prices this year.

Also contributing to the rise in exports were forestry products (up $75 million or 19 percent) and meat and edible offal (up $61 million or 20 percent).

Dairy products were down $32 million (4.1 percent).

Text alternative for Merchandise trade balance – monthly values and balances as % of exports

The column-line graph shows the monthly merchandise trade balances (exports minus imports) on the left y-axis, and balances as a percentage of exports (balance divided by exports) on the right y-axis. The time series ranges from September 2014 to September 2018. In the September 2018 month, the balance was a deficit of $1.6 billion, which is the largest monthly deficit ever. This balance is equivalent to 36 percent of exports.

Annual trade deficit largest since January 2009

25 October 2018, 10:45am

Annual imports of fuels and crude oil rose sharply, driving the trade deficit to $5.2 billion for the September 2018 year, Stats NZ said today.

This year’s trade deficit is the largest annual trade deficit since January 2009.

The deficit widened as imports, especially of fuels, crude oil, and machinery, rose faster than exports, which were led by dairy and meat.

Annual imports for the year ended September 2018 were $62.2 billion, up $8.1 billion (15 percent) from last year. Annual exports for the September 2018 year were $57.0 billion, up $5.9 billion (11 percent) from last year. Both exports and imports reached new highs.

The Reserve Bank trade weighted index (TWI) (measuring the New Zealand dollar against the currencies of key trading partners), has generally been falling since a year ago.

“A falling New Zealand dollar has an upward effect on both export and import prices and their New Zealand-dollar values,” international statistics manager Tehseen Islam said. “Higher international prices of crude oil have also been a factor in the rise of imports.”

Imports of petroleum and products for the year ended September 2018 were $7.1 billion, up $2.0 billion (39 percent) from last year. The biggest changes were:

  • fuels, up $1.0 billion
  • crude oil, up $919 million, mainly reflecting higher international crude oil prices.

Other large increases were:

  • mechanical machinery and equipment (which includes products like turbo-jets and turbo-propellers, bulldozers and excavators, and computers) up $1.2 billion to $8.8 billion
  • vehicles, parts, and accessories, up $715 million to $9.4 billion.

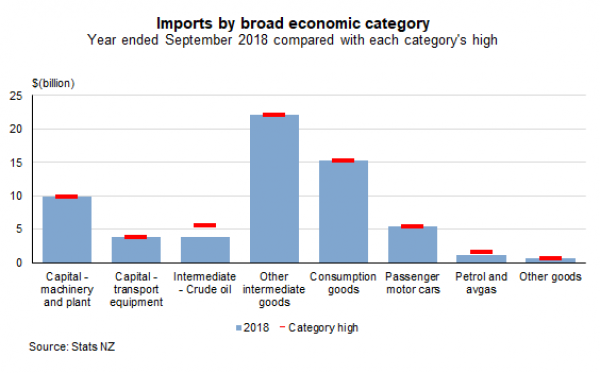
Text alternative for Imports by broad economic category

For the year ended September 2018, the value of dairy exports increased $1.3 billion (10 percent) to $14.4 billion. Milk fats, including butter, led this rise, up $965 million, and milk powder exports also increased, up $315 million.

Meat exports rose $1.2 billion to $7.4 billion. Sheep meat exports increased $803 million, and beef was up $348 million.

Overseas trade visualisation

Overseas trade visualisation is a tool that shows the contributors to total exports and how exports change over time. Data is for the year ended June and is compiled using the level of processing classification.

Text alternative for Imports by broad economic category

The column-scatter graph shows the values of imports by broad economic category for the year ended September 2018 compared with each category’s high. Capital – machinery and plant imports were $9.9 billion, the highest value for this category for all September years. Capital-transport equipment imports were $3.8 billion, the highest value for all September years. Intermediate crude oil imports were $3.9 billion compared with its high of $5.5 billion in 2012. Other intermediate goods imports were $22.1 billion, the category’s highest value. Consumption goods imports were $15.3 billion, the highest value for this category. Passenger motor cars imports were $5.5 billion, the highest value for this category. Petrol and avgas imports were $1.2 billion compared with its category high of $1.7 billion in 2012. Other goods imports were $0.6 billion, the highest value for this category.

Largest quarterly percentage lift in retail card spending since 2010 – Stats NZ Media and Information Release: Electronic card transactions: September 2018

Largest quarterly percentage lift in retail card spending since 2010 – 10 October 2018

Quarterly retail card spending in the September 2018 quarter rose at its fastest pace in seven and a half years, Stats NZ said today.

The lift was widespread, led by increased grocery and liquor spending, as well as fuel.

When adjusted for seasonal effects, retail card spending was up 2.3 percent in the September 2018 quarter, the largest percentage rise since the December 2010 quarter.

“The September quarter’s strong rise came after a slight dip in the June 2018 quarter,” retail statistics manager Sue Chapman said.

Spending rose in all six retail industries in the latest quarter. The largest rise came from the consumables industry (grocery and liquor retailing), up $140 million (2.4 percent). This follows a 0.6 percent fall in the June 2018 quarter. The second largest rise came from the fuel industry, up $65 million (3.4 percent). This follows a 0.3 percent fall in the June 2018 quarter.

“The fuel industry rise coincided with rising petrol prices,” Ms Chapman said.

“Petrol prices rose to record levels, up more than 15 cents a litre by the end of September and more in Auckland after the regional fuel tax was introduced.”

Core retail spending (which excludes the vehicle-related industries) rose 2.1 percent in the September 2018 quarter, after a 0.3 percent fall in the June 2018 quarter.

In actual terms, retail card spending was $16 billion in the September quarter, up $773 million (5.2 percent) from the September 2017 quarter.

Values are only available at the national level and are not adjusted for price changes.

Monthly spending up in September

When adjusted for seasonal effects, retail card spending rose 1.1 percent in the September 2018 month.

“This was the second month in a row where we saw an increase of over 1.0 percent, and retail card spending was up across the board,” Ms Chapman said.

Spending rose across all six retail industries. The largest rise was from the consumables industry (groceries and liquor retailing), up $20 million (1.0 percent). The second largest rise was the durables industry, which includes hardware, furniture, and appliances, up $9.9 million (0.8 percent).

Core retail spending (which excludes the vehicle-related industries) rose 1.1 percent in September 2018, after a 0.9 percent rise in August 2018.

Actual retail spending using electronic cards was $5.2 billion in September 2018, up $280 million (5.7 percent) from September 2017.

Values are only available at the national level and are not adjusted for price changes.

For more information about these statistics:

Lettuce shows largest price fall in four years – Stats NZ Media and Information Release: Food price index: September 2018

Lettuce shows largest price fall in four years – 11 October 2018

Lettuce prices fell 45 percent in September 2018, to an average of $1.81 a head, Stats NZ said today. They were down 30 percent for the year.

“Prices reached an all-time high of $5.42 for a 500g head of lettuce in July 2018 due to poor weather. But since then we’ve had two major price falls, which meant lettuce prices reached an unseasonably low level this September,” consumer prices manager Geraldine Duoba said.

While lettuce averaged $1.81 a head in September 2018, at the same time last year the price was about 80 cents a head higher, at $2.59.


Overall, food prices were almost unchanged in September 2018 (down 0.1 percent), but showed a slight rise after seasonal adjustment (up 0.3 percent).

Vegetable prices fell 8.7 percent in September, influenced by lower prices for lettuce, tomatoes, and cucumbers. However, meat and poultry prices rose 2.0 percent, influenced by higher prices for beef and chicken.

In the year ended September 2018, food prices were also relatively unchanged (up 0.1 percent). This was driven by higher prices for ready-to-eat food (up 3.5 percent), and milk, cheese and eggs (up 2.2 percent). Prices decreased for vegetables (down 8.9 percent) and fruit (down 3.6 percent), which helped keep overall food inflation low for the year.

“After the poor weather and a reduced harvest in 2017, vegetable prices have returned to more typical levels for this time of year,” Ms Duoba said.


For more information about these statistics:
Fibre optic connections increase 54 percent – Stats NZ Media and Information Release: Internet service provider survey: 2018

Fibre optic connections increase 54 percent – 8 October 2018

Nearly 600,000 homes and businesses have high-speed fibre-optic internet connections, a 54 percent increase from 2017, Stats NZ said today.

“Through Ultra-Fast Broadband fibre connections, more New Zealanders are now able to stream movies, play video games, and video-call one another in high-definition, without time lags or buffering,” business performance manager Laura O’Leary said.

Fibre-optic cable supports much of the world’s internet, cable television, and phone systems and is being rolled out around New Zealand. Fibre-optic cabling transmits data via light signals, which allows extremely fast bandwidth speeds into our homes and businesses. This is much faster than traditional copper-wired transmission of data.

Nearly 1 in 3 broadband connections were fibre in 2018, compared with 1 in 8 connections in 2016, the Internet Service Provider Survey shows.

The total number of fibre connections more than doubled in the past two years, to 598,000 at June 2018. From 2017, fibre connections increased by 209,000.

The Ministry of Business, Innovation and Employment’s latest Broadband deployment update shows 1.4 million homes and businesses can access fibre.

“This figure was around 1.2 million last year,” Mrs O’Leary said. “This shows the uptake of New Zealanders connecting to fibre is matching the increase in the availability to connect.”

The Internet Service Provider Survey is an annual survey sent to all internet service providers in New Zealand.

For more information about these statistics:

New Zealand internet is going unlimited – Stats NZ Media and Information Release: Internet service provider survey: 2018

New Zealand internet is going unlimited – 8 October 2018

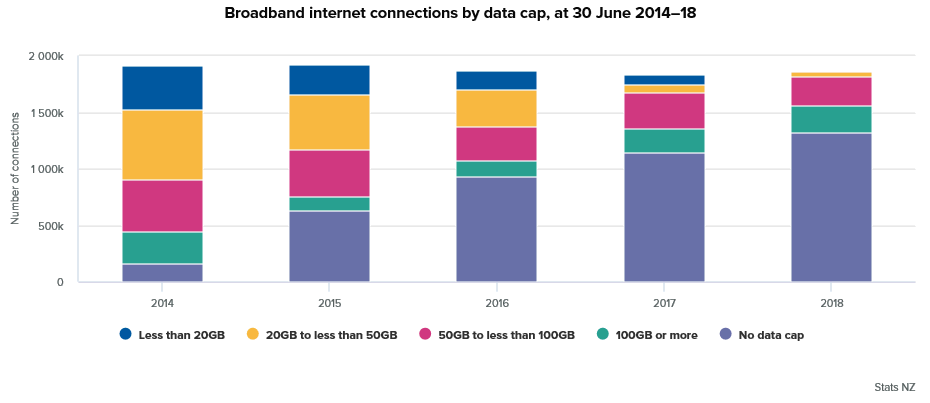
Broadband connections with unlimited data caps made up over 70 percent of all broadband connections in New Zealand in 2018, Stats NZ said today.

There were more than 1.3 million unlimited broadband connections at June 2018, a 16 percent increase from one year ago.

“The increase in unlimited data plans shows New Zealanders’ increasing data needs,” business performance manager Laura O’Leary said. “Unlimited plans have become cheaper and more available nationwide and more people are switching to having unlimited data in their homes and businesses.”


In 2014, only 127,000 residential broadband connections had no data cap. In the last five years, these connections have risen over 700 percent to more than 1 million at June 2018. In the last year alone, unlimited broadband residential connections rose by 182,000.

The proportion of broadband connections with data caps of less than 100 gigabytes decreased considerably over last year. The overall number of broadband connections with a data cap decreased by 21 percent from June 2017.

The total broadband data used in June 2018 measured over 280 million gigabytes.              

“On average this was over 150 gigabytes of data used per broadband connection per month,” Mrs O’Leary said. “This is equivalent to streaming 60 hours of high-definition TV online, or watching all seven seasons of Game of Thrones back to back.”

The Internet Service Provider Survey is an annual survey sent to all internet service providers in New Zealand.

For more information about these statistics:
Part-time workers most likely to lend a hand – Stats NZ Media and Information Release: Labour market statistics (volunteer work): June 2018 quarter

Part-time workers most likely to lend a hand – 18 September 2018

Part-time workers, particularly women and those aged 65 years and older, were the workers most likely to do volunteer work, Stats NZ said today.

“These results from the Household Labour Force Survey are in line with other volunteering data sources,” labour market manager Sean Broughton said.

“We see similar themes across various data sources for volunteer work, but each has a different purpose, context, and collection method.

“This means the data on volunteer work from this survey is not directly comparable with other Stats NZ sources, such as the Time Use Survey and General Social Survey.”

This was the first time questions on volunteer work were included in the Household Labour Force Survey. The data will be collected in the June quarter every two years, with the next being in June 2020.

Volunteer work is non-compulsory, unpaid work performed for others outside a person’s own household or family business.

“This might include volunteering through organisations, such as being a member of your local committee, as well as volunteer work done directly for others, such as mowing your neighbour’s lawn,” Mr Broughton said.

Women working part-time most likely to volunteer

Part-time workers were more likely to do volunteer work than full-time workers. Women who worked part-time were more likely to do volunteer work than men who worked part-time.


Among part-time workers, those aged 65 years and over were more likely to do volunteer work than all other age groups.


Women volunteer more hours

Men accounted for almost 60 percent of paid work hours, with the balance done by women. When it came to volunteering, women did about 60 percent of all volunteered hours.

One-third of all volunteers were people who were not in the labour force, such as retirees and students. However, they did more than 40 percent of total hours volunteered.

Lowest- and highest-paid volunteer most

People who received the least and most (gross) income a week (except those who had no income) from wages and salaries, self-employment, or government transfers had the highest rates of volunteer work. About one-quarter of people who either received a weekly income of less than $500 a week, or received $1,500 or more a week, volunteered.

People who received at least $500 but less than $1,000 a week were more likely to do volunteer work directly for other people than for an organisation. In contrast, those who received $1,500 and over were more likely to do volunteer work for an organisation.

Professionals more likely to volunteer for organisations

People doing paid work in certain occupations and industries were more likely to either volunteer for an organisation or directly for others.

Those whose main paid job was in a professional occupation, such as teachers and nurses, were more likely to do volunteer work for organisations. Similarly, those who worked in the financial and insurance service industry were more likely to do volunteer work for organisations.

Workers in the construction industry were more likely to do volunteer work directly for others.

Caregiving and coaching among most-common activities

The most-common volunteer work was community and personal services, such as caregiving or coaching sports. This was followed by labouring, such as farming or construction activities. These types of volunteer work were more likely to be performed directly for others, rather than for an organisation.

Over 85 percent of all volunteer workers who did organisation-based work did so for a non-profit organisation.

Among non-profit organisations, those related to culture, sport, and recreation had more volunteer workers than other types of organisations. This was followed by non-profit organisations related to religion.

“These volunteers could be coaching local sports teams or helping at their local church,” Mr Broughton said.

For more information about these statistics: