Businesses show growth contrasts after 2008 – 26 October 2018
The number of New Zealand businesses and the number of people they employed went through two contrasting periods in the decade after 2008, Stats NZ said today.
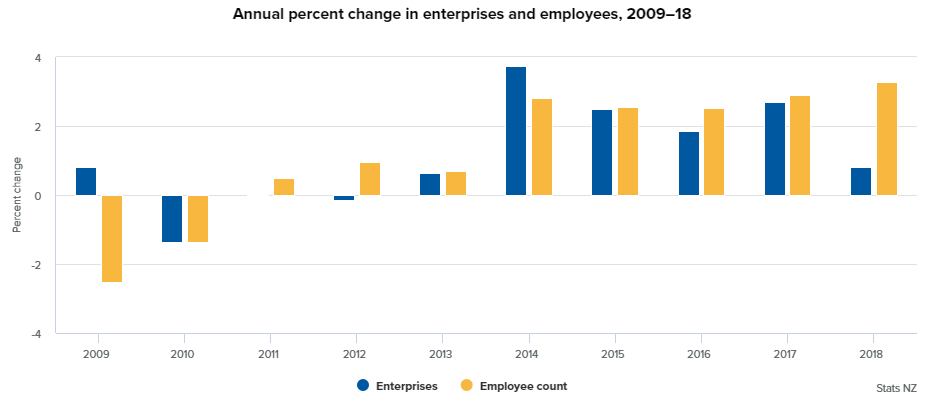
The number of businesses grew more than 12 percent in the five years to 2018 after dipping slightly in the five years after the 2008 global financial crisis (GFC).

“Business demography data for 2009–18 reflects the impact of the GFC and domestic events on New Zealand business counts,” business register manager Mary Reid said.
“Data also reflects the ongoing effect for 2009–13 and how large the recovery was over the following five years.”
Riding rough for five years
Over the five years immediately following the 2008 GFC, both counts – enterprises and employees – struggled to keep up with their pre-GFC levels. In 2013, there were 0.1 percent fewer enterprises and 1.8 percent fewer employees than in 2008.
In contrast, the five years ended February 2018 showed a recovery. The number of enterprises and employees jumped 12.1 percent and 15.0 percent, respectively – an average annual rise of 2.3 percent for enterprises and 2.8 percent for employees. Annual employment growth each year did not dip below 2.5 percent.
Economic growth – a similar story
The New Zealand economy also had two contrasting growth periods after 2008. The average annual economic growth (based on GDP for March years) for 2009–13 was 1.0 percent. For 2014–18, the average annual growth was around 3.3 percent.
Construction industry leads the pack

In the post-GFC recovery, the construction industry was in the lead. After a 4.4 percent drop in employment between 2009 and 2013, employment rebounded with 34.8 percent growth over the next five years.
Administrative and support services employment dropped just 1.2 percent between 2009 and 2013, then added 27.1 percent more employees over the five years to 2018.
Accommodation and food services had a similar turnaround in employment, recovering from a 3.9 percent drop in the first five years to gain 24.7 percent over the last five years.
Manufacturing – still the largest employer in 2018 – had 11.9 percent fewer employees over the five years after 2008, then a 9.2 percent increase in employment over the next five years.
Health care and social assistance was the only industry that maintained some consistency over the whole 10-year period, with employment gains of 10.3 percent and 11.2 percent over the two five-year periods.
Points to note:
- Employee count data in business demography statistics is used primarily as a business size measure – not as an official employment statistic.
- Business demography statistics only cover economically significant enterprises operating in New Zealand. These are mostly those with an annual GST turnover of $30,000 or more.
For more information about these statistics:
