New Zealanders take more overseas trips than ever before – Stats NZ Media and Information Release: International travel and migration: October 2018

New Zealanders take more overseas trips than ever before – 22 November 2018

Over 3 million New Zealand residents arrived back from overseas trips in the year ended October 2018, Stats NZ said today. This was up 175,100 from the October 2017 year.

More and more Kiwis have been taking overseas trips in recent years, with the number growing almost as fast as that for visitor arrivals. Only 10 years ago there were fewer than 2 million trips a year.


Australian school holidays boost visitor numbers

In October 2018, 283,600 visitors arrived in New Zealand, 13,100 more than in October 2017 – led largely by Australia. Visitor arrivals from Australia were up 9.7 percent when compared with October last year.

The largest movements for the month were:

  • Australia (up 9,900)
  • United States (up 3,100)
  • Korea (down 2,200)
  • China (down 1,600).

“More arrivals from Australia was partly due to their school holidays beginning later in September this year than last year,” population insights senior manager Brooke Theyers said.

“More holiday travel in October this year boosted our visitor numbers slightly from the same month in 2017.”

Down month for Asian arrivals

More arrivals from Australia helped compensate for a lower number of visitors from Asia. There were 75,200 visitor arrivals from Asia in October 2018, down 3.7 percent (2,900) from the same month last year.

For recent years Asia has been the fastest growing source region for visitors to New Zealand, which makes October’s fall rather unusual. Despite this fall, for the year ended October 2018 arrivals from Asia were up 8.7 percent (83,100), for a total of 1.04 million visitors.

Departure cards are gone

From 5 November 2018, travellers leaving New Zealand no longer need to complete a passenger departure card. This change affects the release of travel and migration statistics in several ways.

New release schedule

Removing departure cards means changes to the timing and composition of this release. Statistics on short-term movements (including the current report International visitor arrivals to New Zealand) will be published in a new International travel release, and long-term movements in a new International migration release.

Both releases will be published on the same day, up to 30 working days after each reference month. November data, previously published just before Christmas, will now be published in January, and December data in February.

Release calendar

The new release schedule largely reflects the need to use integrated administrative data to provide place-of-residence in New Zealand for migrants and short-term resident travellers. This replaces information from the departure card. The timing is also affected by the new method to produce ‘provisional’ migration estimates.

Integrated Data Infrastructure provides the admin data.

More information

See Migration Data Transformation 

For more information about these statistics:

Net migration is lowest since 2015 – Stats NZ Media and Information Release: International travel and migration: October 2018

Net migration is lowest since 2015 – 22 November 2018

Annual net migration has eased to its lowest level in three years, Stats NZ said today. For the year ended October 2018, it fell to 61,800.

Net migration for the October 2018 month was 6,700, down 1,000 from October 2017.

Overall, net migration was down 8,900 from the October 2017 year, reflecting both fewer migrants arriving in New Zealand and more leaving the country.

For the October 2018 year compared with the October 2017 year:

  • migrant arrivals were 128,100, down 3,500
  • migrant departures were 66,400, up 5,400.


“Although migrant departures continue to be the driving force behind falling annual net migration, October also had a noticeable fall in the number of migrant arrivals,” population insights senior manager Brooke Theyers said.

“Both trends helped bring annual net migration to its lowest level since the year ended September 2015.”


Text alternative for Permanent and long-term migration, year ended October 2018.

Departures for non-New Zealand citizens were 31,800, up 4,400 for the year. Arrivals for non-New Zealand citizens dropped to 96,700, down 2,800.  More New Zealand citizens left the country long-term than returned after living overseas for more than a year – leading to a net loss of 3,100 New Zealand citizens in the 12 months.

Departure cards are gone

From 5 November 2018, travellers leaving New Zealand no longer need to complete a passenger departure card. This change affects the release of travel and migration statistics in several ways.

New release schedule

Removing departure cards means changes to the timing and composition of this release. Statistics on short-term movements (including the current report International visitor arrivals to New Zealand) will be published in a new International travel release, and long-term movements in a new International migration release.

Both releases will be published on the same day, up to 30 working days after each reference month. November data, previously published just before Christmas, will now be published in January, and December data in February.

Release calendar

The new release schedule largely reflects the need to use the Integrated Data Infrastructure to provide place-of-residence in New Zealand for migrants and short-term resident travellers. This replaces information from the departure card. The timing is also affected by the new method to produce ‘provisional’ migration estimates.

Migration estimates

The release in January will fully adopt the outcomes-based measure of migration, first released in May 2017. This measure looks at the travel history of a passenger over a 16-month follow-up period, and classifies a border-crossing according to how long they spent in New Zealand rather than relying on the stated intention on the passenger cards.

Update on the development of provisional external migration estimates

‘Provisional’ migration estimates are a timely measure of migration; they are revised each month until they are finalised after 16 months. Further updates about provisional estimation are planned for late November and December 2018.

‘Final’ migration estimates, based on the ‘12/16-month rule’ and released today on Infoshare, are now updated to June 2017.

Outcomes versus intentions: Measuring migration based on travel histories explains more on the new approach.

More information

See Migration Data Transformation 

Text alternative for Permanent and long-term migration, year ended October 2018

Diagram shows arrivals of non-NZ citizens were 96,700, down 2.8 percent; departures were 31,800, up 16.1 percent; this made a net migration gain of 64,900 non-NZ citizens.

Arrivals of NZ citizens were 31,400, down 2.2 percent; departures were 34,600, up 3.0 percent; this made a net migration loss of 3,100 NZ citizens.

Result is a total net migration gain of 61,800.

Note: Figures may not sum to totals due to rounding. Percentage changes are indicative of the October 2018 year compared with the October 2017 year.

For more information about these statistics:

One in 10 inner city Auckland home transfers go to overseas people – Stats NZ Media and Information Release: Property transfer statistics: September 2018 quarter

One in 10 inner city Auckland home transfers go to overseas people – 30 October 2018

In the September 2018 quarter, 9.8 percent of home transfers in Auckland inner city (Waitemata local board area) were to people who didn’t hold NZ citizenship or a resident visa, down from 22 percent in the June 2018 quarter, Stats NZ said today.

“This quarter’s share of overseas buyers in Auckland’s inner-city is similar to the 9.3 percent of home transfers to overseas people in the September 2017 quarter,” property statistics manager Melissa McKenzie said.

“This may reflect seasonal patterns, but that will not be clear until we get a few more years’ data. These results also may have been influenced by anticipated changes to the Overseas Investment Act.”

The Overseas Investment Amendment Act 2018 came into effect on 22 October 2018, after the September quarter covered in these statistics.

Across the Auckland region, 4.0 percent of home transfers in the September 2018 quarter were to people who didn’t hold NZ citizenship or a resident visa.

Transfers to this group varied across Auckland local board areas, for example:

  • Waitemata – 9.8 percent
  • Upper Harbour – 8.9 percent
  • Manurewa – 1.2 percent.

Resident visa holders and corporate buyers also vary significantly across Auckland

Auckland’s Upper Harbour, Howick, and Henderson-Massey local board areas had the highest rates of home transfers to resident visa holders in the September 2018 quarter.

“Resident visa holders could have lived in NZ for many decades and chosen not to get citizenship, or they could be people who have only held a resident visa for a very short time,” Ms McKenzie said.

Together, visa holders and overseas people accounted for more than a third of all home transfers in Upper Harbour, and a quarter of all transfers in Howick. For NZ excluding Auckland, this group accounted for 7.0 percent of home transfers.

In Auckland’s Manurewa, Otara-Papatoetoe, and Maungakiekie-Tamaki local board areas at least 20 percent of home transfers were to corporate buyers in the September 2018 quarter. For NZ excluding Auckland, this group accounted for 8.7 percent of home transfers.

Information on the ownership of corporates (by New Zealanders or overseas people) is not currently available.

Nationally, 2.0 percent of home transfers were to people who didn’t hold NZ citizenship or a resident visa in the September 2018 quarter, down from 2.3 percent in the September 2017 quarter and 2.8 percent in the June 2018 quarter. When Auckland is excluded, 1.2 percent of all home transfers in the September 2018 quarter were to this group.

Frequently asked questions

How many ‘foreigners’ are buying New Zealand homes?

It depends how you define ‘foreigner’. In the September 2018 quarter, of all home transfers:

  • 79 percent were to at least one New Zealand citizen
  • 10 percent were to corporate entities only (which could have New Zealand or overseas owners)
  • 8.4 percent were to at least one NZ-resident-visa holder (someone who can live and work in New Zealand for as long as they like)
  • 2.0 percent were to no NZ citizens or resident visa holders.

When we talk about transfers to ‘overseas people’, we mean the 2.0 percent of transfers where none of the buyers were NZ citizens or resident-visa holders (excluding transfers where all the buyers were corporate entities). We focus on this measure because it aligns most closely with the definition of ‘overseas person’ in the Overseas Investment Act 2005.

What about the Overseas Investment Amendment Act 2018?

Intentions to tighten ‘foreign’ buyer rules were first discussed in late 2017. It is possible that the announcement and implementation of the Overseas Investment Amendment Act 2018 may have influenced property transfer statistics. The new Act didn’t come into effect until 22 October 2018, after the September 2018 quarter.

For further information see Overseas Investment Amendment Act 2018.

Why do you talk about ‘transfers’ not ‘sales’?

A transfer is not the same as a sale. Transfers often involve a sale, but there are many other possible reasons for a transfer (such as marriage settlements, the death of a family member, boundary changes, and trustee changes).

Every sale is a transfer, but not every transfer is a sale. We refer to the parties involved as buyers and sellers for simplicity.

We know the number of transfers to overseas people because this information is collected on land transfer tax statements, which cover all types of transfer and not just sales.

How many of the corporate entities have ‘foreign’ owners?

Information on the ownership of corporate entities (by New Zealanders or overseas people) is not currently available, as it is not collected on land transfer tax statements.

How are trusts captured in these statistics?

We count a trust based on the visa or citizenship status of its trustees. If at least one trustee holds NZ citizenship, then the transfer is counted as a transfer to a NZ citizen.

Aren’t there lots of people missing from these numbers?

We have information about the visa status or citizenship of virtually all people who transfer property in New Zealand. The only uncertainty is around the ownership of corporate entities that transfer property.

In addition to statistics about the visa status or citizenship of people who transfer property, we also publish statistics about their tax residency. The tax residency statistics include a large category for parties that are exempt from stating their tax residency on a land transfer tax statement (eg because the transfer involves their main home). The visa and citizenship statistics are not affected by this exemption, because these people are still required to state their visa or citizenship status.

Tax residency is not the same as nationality. We advise focusing on the statistics about visa or citizenship status (also known as affiliation).

How much New Zealand property is owned by ‘foreigners’?

We do not currently have a register of property owned by overseas people. These property transfer statistics measure overseas involvement in property transfers in any given quarter, but not the total amount of property owned by overseas people.

What is the net change in ‘foreign’ ownership of New Zealand property?

We don’t produce a measure of the net change in property owned by overseas people.

If you subtract seller statistics from buyer statistics to calculate a net change in home ownership, it is important to note that:

  • between the time of buying and selling a home, owners can move between affiliations (eg a work-visa holder could become a resident-visa holder or NZ citizen)
  • some types of affiliations may sell many newly built homes (eg corporate entities).

Therefore, net changes for a given affiliation could be understated or overstated.

For more information about these statistics:

Asian markets boost visitor arrivals – Stats NZ Media and Information Release: International visitor arrivals to New Zealand: September 2018

Asian markets boost visitor arrivals – 24 October 2018

New Zealand had 258,200 overseas visitor arrivals in September 2018, up 5,400 from the same month last year, Stats NZ said today.

Australia remains New Zealand’s single biggest source of visitors, but an increasing number of visitors came from Asia in September, which is typically a lower season for tourists.

Although nearly half of all visitors in September 2018 were from Australia (123,500), numbers were down 3,500 on September last year.

In contrast, visitor arrivals from Asia were up 5,100 compared with September last year, continuing an ongoing trend. The increased arrivals came from:

  • China (up 1,700)
  • Malaysia (up 1,600)
  • Hong Kong (up 700).

Visitor numbers from the United States were also up 1,800 compared with September last year.

Sydney most popular airport

In September 2018, 65,800 visitors arrived from Sydney, making it the most popular port for flights to New Zealand. Including Sydney, four of the top five source ports for visitor arrivals were in Australia, the others being:

  • Melbourne (44,700)
  • Brisbane (34,700)
  • Coolangatta (13,600).

Hong Kong was the only non-Australian port in the top five, and was the source of 11,100 overseas visitor arrivals in September 2018.

Holidaymakers reach 2 million in September year

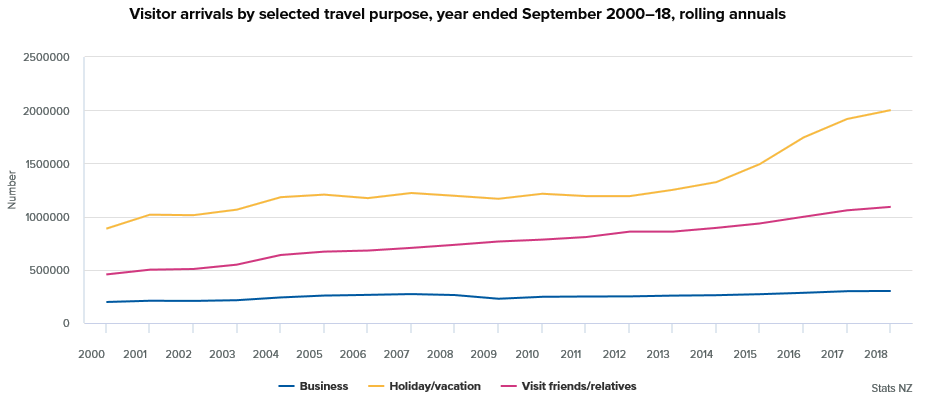
Visitors arriving for the main purpose of a holiday reached 2 million in the year ended September 2018. This was up 83,300 from the year ended September 2017 – the first time a September year has reached this level.

Travelling for a holiday or vacation was the most common reason for visiting New Zealand. Other travel purposes were:

  • visiting friends and relatives (1.09 million)
  • business (301,900)
  • attending conferences/conventions (76,800)
  • education (68,400).

Australia accounted for over half of visitors travelling to visit friends and relatives (577,700).

Total visitor arrivals for the September 2018 year were 3.81 million, up 130,900 from the September 2017 year.

Final days for departure cards

From 5 November 2018, travellers leaving New Zealand will no longer need to complete a passenger departure card (see Final call for travel departure cards). This change will see a full adoption of the outcomes-based measure of migration, first released in May 2017 (see Outcomes versus intentions: Measuring migration based on travel histories).

Update on migration estimates

Stats NZ is also developing provisional migration estimates to maintain timely statistics. An update was published in early October (see Update on the development of provisional external migration estimates) and further updates are planned for November and December.

New release schedule

The removal of the departure card means changes to the timing and composition of the International travel and migration release. Statistics on short-term movements (including the current report International visitor arrivals to New Zealand) will be published via a new ‘International travel’ release, and long-term movements in a new ‘International migration’ release. Both releases will be published on the same day, up to 30 working days after each reference month. November data, previously published just before Christmas, will now be published in January, and December data in February (see Release calendar).

The new release schedule largely reflects the need to use integrated administrative data (ie Stats NZ’s Integrated Data Infrastructure) to provide place-of-residence within New Zealand of migrants and short-term resident travellers. This replaces information from the departure card. The timing is also affected by the new method to produce provisional migration estimates.

For more information about these statistics:

Migration drives local population growth – Stats NZ Media and Information Release: Subnational population estimates: At 30 June 2018 (provisional)

Migration drives local population growth – 23 October 2018

The estimated resident population of all 16 regions grew in the year ended 30 June 2018, Stats NZ said today.

This was the first time in eight years that the population increased in every region, following occasional years of decreases in the West Coast, Manawatu-Wanganui, Canterbury, and Marlborough.

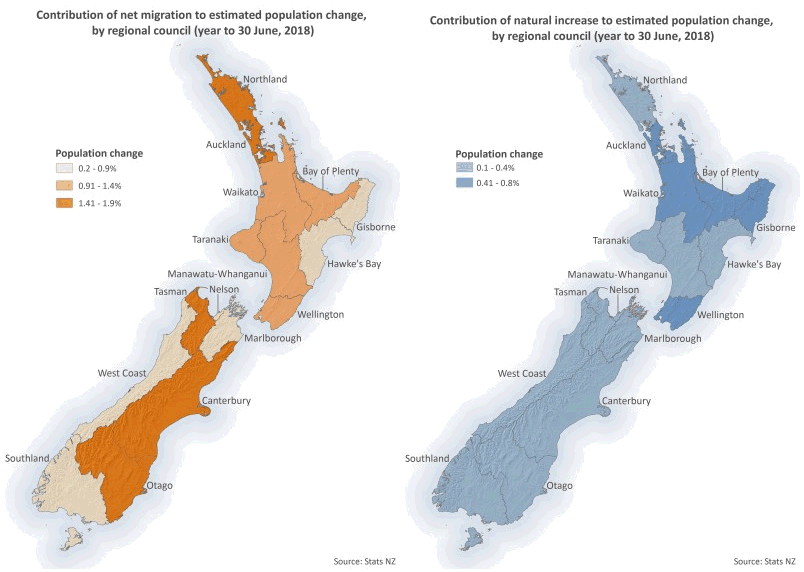
Population growth in most regions was driven by the combined effect of international and internal net migration (arrivals minus departures).

“This reflects the national trend, where migration has been the largest component of New Zealand’s population growth in recent years,” population insights senior manager Brooke Theyers said.

Gains from net migration ranged from about 90 percent in Tasman and Nelson regions to about half the growth in Gisborne and Southland regions, with natural increase contributing to the rest.

Estimated resident population change by component (year to 30 June, 2018), interactive map

The subnational population estimates in this release supplement the national population estimates at 30 June 2018. They are based on 2013 Census results and estimated population change since then. Revised population estimates will be released in 2019 after 2018 Census results are available.

Territorial authority areas and Auckland local board areas

All but one of New Zealand’s 67 territorial authority areas (TAs) and 21 Auckland local board areas (LBA) experienced population growth in 2018.

The fastest growing TAs were not cities. They were Queenstown-Lakes district (5.5 percent), Selwyn district (4.8 percent), and Central Otago district (3.6 percent) in the South Island; and Kaipara district (3.1 percent) in the North Island.

“These districts are growing more rapidly than the national average of 1.9 percent,” Ms Theyers said. “However, growth was also consistently strong elsewhere in Otago, Canterbury, and Northland and this contributed significantly to the large population increase in these regions.”

Similar trends were seen across Auckland’s 21 LBAs. Population increased in every local board area, the fastest being in Waitemata (4.9 percent), Papakura (4 percent), Upper Harbour (3.9 percent), and Rodney (3.8 percent). Auckland accounted for 42 percent of the country’s population growth over the year and is now home to 35 percent of New Zealanders.

Net migration was also the main driver of population change in the TAs and LBAs. More deaths than births occurred in seven TAs, but the net migration in these areas was high enough to outweigh the natural decrease.

The TAs that experienced natural decrease but overall population growth were Kapiti Coast, Thames-Coromandel, Horowhenua, Buller, Waitaki, Timaru, and Waimate districts.

Seven areas also experienced negative net migration (more departures than arrivals). These were Mangere-Otahuhu LBA and Waitomo, Ruapehu, Whakatane, Tararua, Wairoa, and Hurunui districts.

Higher natural increase (more births than deaths) resulted in overall population growth in all these areas except for Waitomo, where natural increase was outweighed by migrant outflows.

New Zealand’s estimated resident population (year end 30 June, 2018), interactive map

For more information about these statistics:

Fall continues in annual net migration – Stats NZ Media and Information Release: International travel and migration: September 2018

Fall continues in annual net migration – 19 October 2018

Annual net migration was 62,700 for the year ended September 2018, down 8,300 from the year ended September 2017, Stats NZ said today.

Migration continues to ease from the record levels seen last year.

There were 129,000 migrant arrivals (down 2,600) and 66,200 migrant departures (up 5,600) in the year ended September 2018 compared with the same period last year.

Of the 66,200 migrant departures, more than half were New Zealand citizens (34,500). However, non-New Zealand citizens leaving the country rose to 31,800 over the 12 months.

“The increase in migrant departures, and decrease in migrant arrivals, both contributed to a lower net migration level,” population insights senior manager Brooke Theyers said.

“However, the increase in migrant departures had a greater effect as the change was larger, particularly for non-New Zealand citizens.”

Non-New Zealand citizen departures were up 4,800 for the September 2018 year compared with the September 2017 year, whereas departures for New Zealand citizens only rose 800.

Arrivals on work visas up 2.5 percent

Migrant arrivals on work visas increased 2.5 percent (1,100) to 46,900 in the year ended September 2018. The different types of work visas cater to those on working holidays, seasonal workers or other working schemes. These visa types were the most popular for permanent and long-term arrivals into New Zealand, accounting for 36 percent of all migrant arrivals.

The largest group of migrants arriving on work visas was from the United Kingdom (7,200). The next largest groups were from:

  • France – 3,800
  • Australia – 3,200
  • Germany – 3,200.

Final days for departure cards

From 5 November 2018, travellers leaving New Zealand will no longer need to complete a passenger departure card (see Final call for travel departure cards). This change will see a full adoption of the outcomes-based measure of migration, first released in May 2017 (see Outcomes versus intentions: Measuring migration based on travel histories).

Update on migration estimates

Stats NZ is also developing provisional migration estimates to maintain timely statistics. An update was published in early October (see Update on the development of provisional external migration estimates) and further updates are planned for November and December.

New release schedule

The removal of the departure card means changes to the timing and composition of the International travel and migration release. Statistics on short-term movements (including the current report International visitor arrivals to New Zealand) will be published via a new ‘International travel’ release, and long-term movements in a new ‘International migration’ release. Both releases will be published on the same day, up to 30 working days after each reference month. November data, previously published just before Christmas, will now be published in January, and December data in February (see Release calendar).

The new release schedule largely reflects the need to use integrated administrative data (ie Stats NZ’s Integrated Data Infrastructure) to provide place-of-residence within New Zealand of migrants and short-term resident travellers. This replaces information from the departure card. The timing is also affected by the new method to produce provisional migration estimates.

For more information about these statistics:

Stats NZ Report: International Visitor Arrivals to New Zealand: August 2018

International Visitor Arrivals to New Zealand

25 September 2018

The latest edition of International Visitor Arrivals to New Zealand: August 2018 (IVA) is now available on the Stats NZ website.

IVA is a monthly report produced by Stats NZ and sponsored by Tourism New Zealand. It contains detailed tables and graphs of monthly and annual data, showing the number and characteristics of visitor arrivals. IVA provides information in addition to the visitor arrivals information released two working days earlier in the International Travel and Migration: August 2018 release. In particular, airport information released in the IVA is not included in the international travel and migration statistics.

Visitor numbers boosted by Asia-Pacific region – Stats NZ Media and Information Release: International travel and migration: August 2018

Visitor numbers boosted by Asia-Pacific region

21 September 2018

Visitor numbers for August 2018 were up 5.4 percent from August 2017, Stats NZ said today.

There were 246,700 visitor arrivals in August 2018, 12,700 more than for August 2017. The biggest changes were:

  • Australia up 3,100 to 114,400
  • China up 2,300 to 31,500
  • Malaysia up 1,200 to 5,600.

Visitor arrivals increased across every region in August 2018. Arrivals from the Asia region increased the most, up 5,100 (or 7.6 percent) from August 2017. Changes in other regions were:

  • Oceania (Australia and the Pacific) up 5,000 (4.1 percent)
  • Americas up 1,700 (9.7 percent)
  • Europe up 600 (2.8 percent)
  • Africa and the Middle East up 200 (6.7 percent).

For the year ended August 2018, visitor arrivals were up 133,100 (3.6 percent) to 3.8 million.

Travel at a glance

The two maps use travel data to show the top source countries for visitor arrivals to New Zealand and top destinations for New Zealand-resident travellers. They illustrate the key travel interactions between New Zealand and the rest of the world.


Table 3 of International travel and migration: August 2018 (Excel) has the figures for the map Top 30 source countries of overseas visitors to New Zealand.

Visitors arrive in New Zealand from all over the globe, but more come from Australia than anywhere else. Australia accounted for 39 percent of all visitor arrivals in the August 2018 year.


Table 5 of International travel and migration: August 2018 (Excel) has the figures for the map Top 30 destination countries for New Zealand-resident travellers.

Although Australia dominates as a destination for Kiwi travellers, our Pacific neighbours are also popular travel destinations.

Tourism and migration visualiser shows a more detailed breakdown of arrivals and departures, and migration information. Use this tool to analyse travel data for any country.

For more information about these statistics:

Net migration eases back towards 2015 level – Stats NZ Media and Information Release: International travel and migration: August 2018

Net migration eases back towards 2015 level – 

21 September 2018

Annual net migration was down 8,800 (to 63,300) in the August 2018 year when compared with the August 2017 year, Stats NZ said today.

This is the lowest August year since 2015. Net migration is continuing to ease from the record high of 72,400 in the year ended July 2017.

Migrant arrivals were 129,100 and migrant departures were 65,800 for the latest year.


“The number of migrant arrivals in August was only slightly lower than in August 2017, so it was the increase in the number of departures that led to the fall in net migration.” population insights senior manager Brooke Theyers said.

“This is consistent with what we’ve seen in previous months, with the fall in net migration being driven more by increases in migrant departures than decreases in migrant arrivals.”

Migrant departures to Australia still historically low

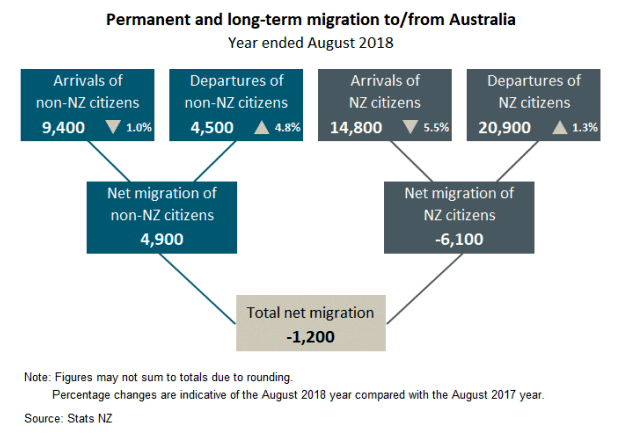
Migrant departures for New Zealand citizens were up 600 for the year ended August 2018, to 34,200. Of these, 20,900 were to Australia.

This increase in departures was accompanied by a fall in the number of citizens returning to New Zealand from Australia, which led to a net outflow of 1,200 migrants.


Text alternative for Permanent and long-term migration to/from Australia, year ended August 2018.

“New Zealand’s net migration with Australia is typically negative so dropping below zero is not unusual.” Mrs Theyers said.

“Historically, New Zealand citizen departures have been much higher. For example, in 2012 there were 48,700 New Zealand citizens who departed to Australia, which led to a net migrant loss of 40,000.”

Both 2016 and 2017 had small positive net migration gains with Australia, due to low numbers of New Zealand citizen departures and record numbers of New Zealand citizens arriving (expats returning home).


Departure cards taking flight

From November 2018, travellers leaving New Zealand will no longer need to complete a passenger departure card. This change means the outcomes-based measure of migration, first released in May 2017, will be fully adopted.

To maintain timely statistics, Stats NZ is developing provisional migration estimates; early results were published in August 2018. More information on the statistical model to produce provisional estimates will be published in early October 2018.

Final call for travel departure cards

Defining migrants using travel histories and the ’12/16-month rule’

First look at provisional external migration estimates

Text alternative for Permanent and long-term migration to/from Australia, year ended August 2018

Diagram shows permanent and long-term migration to/from Australia. Arrivals of non-NZ citizens were 9,400, down 1.0 percent; departures of non-NZ citizens were 4,500, up 4.8 percent; this makes the net migration gain of non-NZ citizens 4,900.

Arrivals of NZ citizens were 14,800, down 5.5 percent; departures of NZ citizens were 20,900, up 1.3 percent; this makes the net migration loss of NZ citizens -6,100.

Result is total net migration of -1,200.

Note: Figures may not sum to totals due to rounding. Percentage changes are indicative of the August 2018 year compared with the August 2017 year.

The Government Statistician authorises all statistics and data we publish.

For more information about these statistics: